
KANDIKA HEAT MAP
Gösterge
1 satın almalar
Sürüm 1.0, Jul 2025
Windows, Mac
4.6
Değerlendirmeler: 3
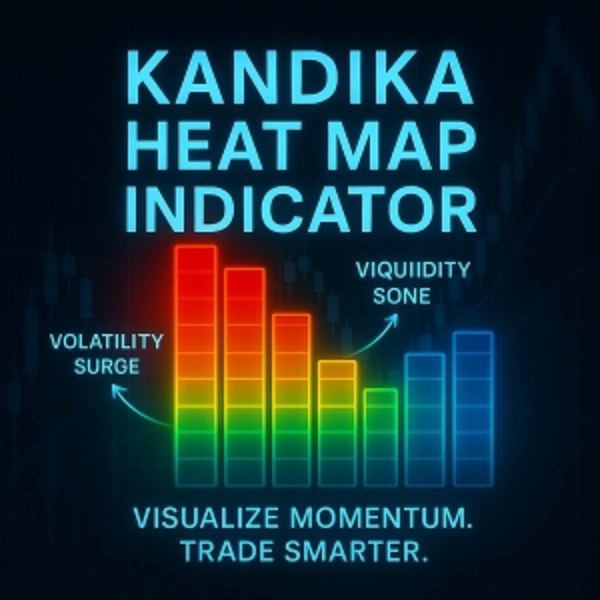
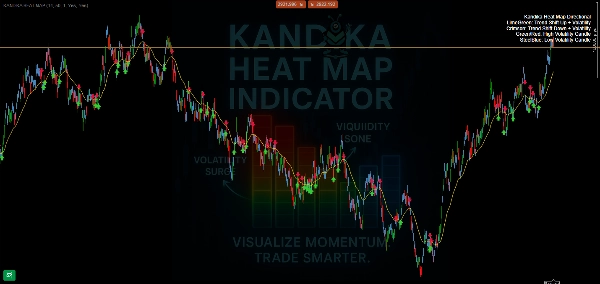
🎨 Renk Mantığı – Size Ne Anlatır
- 🟩 Lime Yeşili → Trend Yükselişi
Boğa momentumu değişimi oluşuyor. Erken yükselişi yakalamak için kullanın. - 🟥 Kızıl → Trend Düşüşü
Aşağı yönlü baskının arttığını gösterir. Potansiyel short pozisyonlar veya çıkışlar için sizi hazırlar. - 🟧/🔴 Turuncu/Kırmızı → Yüksek Volatilite Bölgesi
Fiyat sıçramaları, hızlı hareketler ve potansiyel tuzaklar bekleyin. Körü körüne tahmin yapacağınız bir yer değil—stratejinizi doğrulayın. - 🟦 Çelik Mavisi → Düşük Volatilite Bölgesi
Piyasa yavaşlıyor, sıkışıyor veya yatay seyrediyor. Genellikle kırılma fırsatları için zemin hazırlar.
📊 Ne Yapar (Ne Yapmaz)
- ✅ Trend yönü değişikliklerini net bir şekilde haritalar
- ✅ Sakin ve volatil bölgeleri görsel olarak ayırır
- ✅ Basit, grafik dostu kaplama—karmaşa yok
Gösterge profili
4.6
Değerlendirmeler: 3
5 | 67 % | |
4 | 33 % | |
3 | 0 % | |
2 | 0 % | |
1 | 0 % |
Müşteri değerlendirmeleri
August 4, 2025
No reason to yolo this live without a few normal sessions, and Bad settings can ruin the idea.
July 26, 2025
20 percent less clicking is the line to watch. Market checks feel quicker.
cTrader Store üzerinden erişilebilen işlem botları, göstergeler ve eklentiler gibi ürünler, üçüncü taraf sağlayıcılar tarafından sağlanır ve yalnızca bilgilendirme ve teknik erişim amaçlarıyla sunulur. cTrader Store bir broker değildir ve yatırım tavsiyesi, kişisel öneriler vermez veya gelecekteki performansı garanti etmez.


Başlangıç 08/06/2025
1
Satışlar