
Açıklama
IM_AngleIndicator basit hareketli ortalamanın eğimini nesnel, karşılaştırılabilir bir açısal ölçüye dönüştürür.
Çoğu "açı" göstergesi eğimi ham fiyat değişiminden hesaplar, ancak sonuç enstrümanın mutlak ölçeğine ve zaman dilimine bağlıdır — bu yüzden aynı derece değeri bir döviz çifti, bir endeks veya bir kripto para biriminde tamamen farklı şeyler ifade eder. IM_AngleIndicator bunu SMA değişimini ATR ile normalize ederek çözer: eğim "bar başına ATR" olarak ifade edilir ve sonra dereceye dönüştürülür. Bu şekilde, 45° eğim her zaman analiz edilen enstrüman veya zaman diliminden bağımsız olarak bar başına 1 ATR hareketini temsil eder. Sonuç tutarlı bir okuma ve tüm portföyde yeniden kullanılabilecek eşik değerlerdir.
Nasıl çalışır
- Seçilen periyoda göre kapanış fiyatlarında SMA'yı hesaplar.
- İki ardışık bar arasındaki değişimini ölçer ve ATR'ye bölerek normalize eder.
- Ortaya çıkan oranı arktanjant ile dereceye çevirir, yaklaşık olarak −90° ile +90° arasında bir değer döndürür.
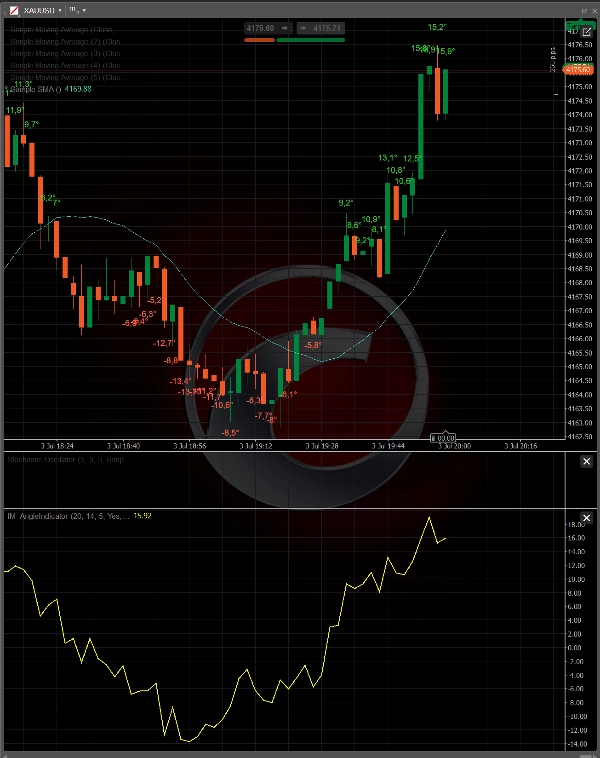
- Değeri özel bir panelde osilatör olarak çizer ve eğim belirlenen eşiği aştığında, fiyat grafiğinde yüksek seviyenin üstünde (boğa trendi) veya düşük seviyenin altında (ayı trendi) bir etiket ekler.
Temel özellikler
- ATR normalizasyonu sayesinde enstrüman ve zaman diliminden bağımsız eğim ölçümü.
- Önemli hareketleri filtrelemek ve gürültüyü dışlamak için derece cinsinden yapılandırılabilir eşik.
- Yönü gösteren renk kodlu etiketler (yükseliş için yeşil, düşüş için kırmızı) ve mumlara göre temiz yerleşim için ATR tabanlı dikey ofset.
- Optimum grafik nesnesi yönetimi: performansı korumak için etiketler en son barlarla sınırlıdır, uzun geçmişe sahip grafiklerde bile.
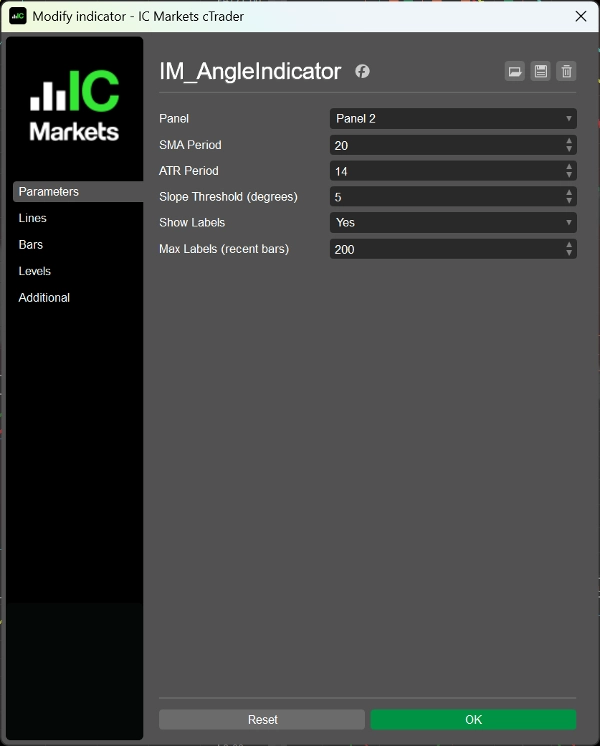
- Tam özelleştirilebilir parametreler: SMA periyodu, ATR periyodu, eğim eşiği, etiket görünürlüğü ve maksimum etiket sayısı.
Kullanım alanları
- Güçlü trend fazlarını yanlamasına aralıklardan ayırt etmek.
- Giriş ve çıkış stratejilerini desteklemek için yön doğrulaması.
- Aynı eşik kullanılarak birden fazla enstrümanda trend gücünü karşılaştırmak.
- Normalize edilmiş eğimi ticaret sinyali olarak kullanan cBot'lar geliştirmek için temel.
Özet
Müşteri değerlendirmeleri
5 | 50 % | |
4 | 50 % | |
3 | 0 % | |
2 | 0 % | |
1 | 0 % |


