

present
ลงทะเบียนและรับส่วนลด $50 สำหรับการซื้อครั้งแรกของคุณ
Trading product for Fixed Range Volume profile อินดิเคเตอร์ Key Levels Imbalance, image 1
Fixed Range Volume profile
อินดิเคเตอร์
1 การซื้อ
เวอร์ชัน 1.0, Jul 2026
Windows, Mac
Trading product for Fixed Range Volume profile อินดิเคเตอร์ Key Levels Imbalance, image 2
Trading product for Fixed Range Volume profile อินดิเคเตอร์ Key Levels Imbalance, image 3
Trading product for Fixed Range Volume profile อินดิเคเตอร์ Key Levels Imbalance, image 4
ตั้งแต่ 14/01/2025
2
การขาย
143
ติดตั้งฟรี

คำอธิบาย

โปรไฟล์ปริมาณช่วงคงที่ (FRVP)

ตัวบ่งชี้โปรไฟล์ปริมาณตรวจจับอัตโนมัติ


--------------------------------------------------


การกระจายปริมาณ พื้นที่มูลค่า โหนดปริมาณสูง ทั้งหมดจากเส้นแนวโน้มของคุณ


--------------------------------------------------


สิ่งที่ตัวบ่งชี้นี้ทำ


โปรไฟล์ปริมาณช่วงคงที่ (FRVP) แสดงการกระจายปริมาณในช่วงที่ผู้ใช้กำหนด — ตรวจจับเส้นแนวโน้มล่าสุดที่คุณวาดบนแผนภูมิโดยอัตโนมัติ


ไม่ต้องเลือกช่วงด้วยตนเอง เพียงวาดเส้นแนวโน้มและโปรไฟล์จะปรากฏขึ้น


--------------------------------------------------


คุณสมบัติหลัก


- ตรวจจับเส้นแนวโน้มล่าสุดโดยอัตโนมัติ (ไม่ต้องตั้งชื่อด้วยตนเอง)

- จุดควบคุม (POC) - ระดับปริมาณสูงสุด

- พื้นที่มูลค่า (VAH + VAL) - เปอร์เซ็นต์ที่ปรับได้ (ค่าเริ่มต้น 70%)

- โหนดปริมาณสูง (HVN) - ปริมาณสูงกว่าค่ากลางเฉลี่ย

- แสดงฮิสโตแกรม (ด้านซ้ายหรือขวาของช่วง)

- กำหนดจำนวนแถวได้ (10 ถึง 200)

- ปรับแต่งสีและความทึบแสงได้

- ขยายเส้นไปทางขวา

- แสดง/ซ่อนป้ายราคา

- ไม่มีการวาดซ้ำ


--------------------------------------------------


วิธีการทำงาน


1. วาดเส้นแนวโน้มบนแผนภูมิ

2. ตัวบ่งชี้ตรวจจับโดยอัตโนมัติ

3. คำนวณโปรไฟล์ปริมาณจากช่วง

4. แสดง POC, VAH, VAL และ HVN


ไม่ต้องตั้งชื่อ ไม่ต้องเลือกช่วงด้วยตนเอง


--------------------------------------------------


องค์ประกอบภาพ


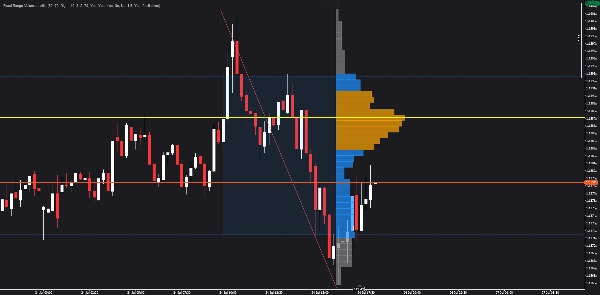
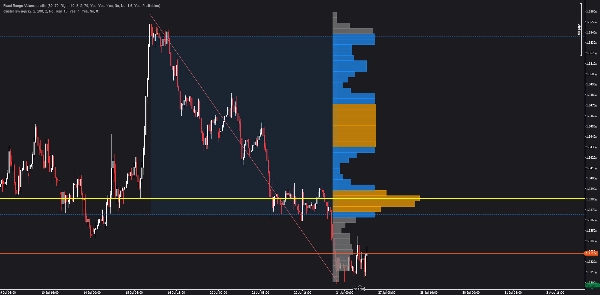
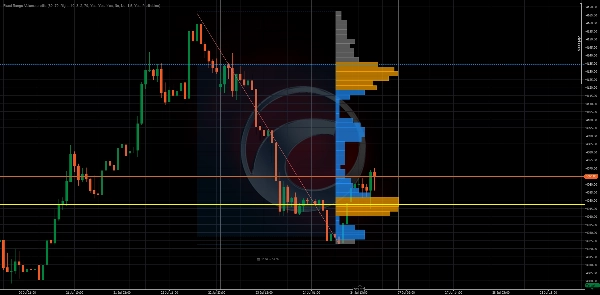
- เส้นแนวนอนสีเหลือง = จุดควบคุม (POC)

- เส้นประสีน้ำเงิน = พื้นที่มูลค่าสูง (VAH) และพื้นที่มูลค่าต่ำ (VAL)

- แถบสีส้ม = โหนดปริมาณสูง (HVN)

- แถบสีเทา = โหนดปริมาณต่ำ

- พื้นที่มีเงา = พื้นที่มูลค่า (70% ของปริมาณ)

- ฮิสโตแกรม = การกระจายปริมาณตามระดับราคา


--------------------------------------------------


ภาพรวมพารามิเตอร์


การตั้งค่าโปรไฟล์:

- จำนวนแถว: จำนวนแถวราคา (10-200)

- เปอร์เซ็นต์พื้นที่มูลค่า: % ของปริมาณในพื้นที่มูลค่า (1-100)


การตั้งค่าภาพ:

- ด้านโปรไฟล์: ซ้ายหรือขวาของช่วง

- ความกว้างฮิสโตแกรม %: ความกว้างของแถบฮิสโตแกรม

- การปรับขนาดความกว้างแถบ: ตัวคูณสำหรับความกว้างแถบ

- ความกว้างแถบขั้นต่ำ %: ความกว้างแถบขั้นต่ำ

- ความทึบแสงแถบ: ความโปร่งใสของแถบ (10-100)


สี:

- สี POC

- สีพื้นที่มูลค่า

- สีโหนดปริมาณสูง

- สีปริมาณต่ำ


โหนดปริมาณสูง:

- เกณฑ์ HVN: ตัวคูณปริมาณเพื่อกำหนดเป็น HVN


การตั้งค่าเส้นแนวโน้ม:

- ตรวจจับล่าสุดอัตโนมัติ: ค้นหาเส้นแนวโน้มล่าสุดโดยอัตโนมัติ

- ชื่อเส้นแนวโน้มด้วยตนเอง: ระบุชื่อ (ถ้าปิดการตรวจจับอัตโนมัติ)


--------------------------------------------------


กรณีการใช้งาน


- ระบุว่าปริมาณส่วนใหญ่เกิดขึ้นที่ไหน

- หาจุดควบคุม (POC) สำหรับการเข้า/ออก

- ใช้พื้นที่มูลค่า (VAH/VAL) สำหรับเป้าหมายกำไร

- ระบุโหนดปริมาณสูง (HVN) สำหรับระดับสำคัญ

- เข้าใจการกระจายปริมาณได้อย่างรวดเร็ว

- รวมกับตัวบ่งชี้อื่นเพื่อความสอดคล้อง


--------------------------------------------------


อัปเกรดเป็นโซนความร้อนเชิงโครงสร้าง


ตัวบ่งชี้นี้แสดงการกระจายปริมาณให้คุณ


โซนความร้อนเชิงโครงสร้างก้าวไปอีกขั้น — มันแผนที่ความเข้มข้นของการมีส่วนร่วม การยอมรับเทียบกับการปฏิเสธ และการมีส่วนร่วมของตลาดในหลายโซน


ค้นหาโซนความร้อนเชิงโครงสร้างในร้านค้า cTrader


--------------------------------------------------


อัปเกรดเป็น Invictus EA


Invictus EA ใช้เทคโนโลยีเชิงโครงสร้างเพื่อดำเนินการซื้อขายอัตโนมัติ


ค้นหา Invictus ในร้านค้า cTrader


--------------------------------------------------


บันทึกทางเทคนิค


- ตัวบ่งชี้ซ้อนทับ

- ทำงานบนกรอบเวลาหรือสัญลักษณ์ใดก็ได้

- ไม่มีการวาดซ้ำ (คำนวณจากประวัติ)

- ปรับแต่งเพื่อประสิทธิภาพ


--------------------------------------------------


การสนับสนุน


รวมการอัปเดตตลอดชีพ


สำหรับข้อมูลเพิ่มเติม - คลิกโปรไฟล์นักพัฒนาด้านล่าง

สรุป

สรุปโดย AI
Fixed Range Volume Profile (FRVP) is a volume profile indicator designed for trading charts that automatically detects the latest trendline drawn by the user. It calculates and displays volume distribution within the fixed range defined by this trendline, eliminating the need for manual range selection. Key features include visualization of the Point of Control (POC) representing the highest volume price level, Value Area High (VAH) and Value Area Low (VAL) defining a configurable percentage (default 70%) of total volume, and High Volume Nodes (HVN) indicating volume above an average threshold. The indicator presents these elements as a histogram on either side of the range, with customizable rows, colors, opacity, and the option to extend lines to the right. Visual elements include yellow horizontal lines for POC, blue dashed lines for VAH and VAL, orange bars for HVN, and shaded regions for the value area. FRVP works on any timeframe and symbol without repainting, providing a stable overlay for volume analysis. Typical use cases involve identifying key volume levels for entries, exits, and profit targets, as well as understanding volume distribution and combining with other indicators for confluence. The indicator supports extensive visual and profile parameter customization to suit individual trading preferences.
โปรไฟล์อินดิเคเตอร์
หมวดหมู่อินดิเคเตอร์
ปริมาณ
ประเภทเอาต์พุต
การแสดงเป็นภาพ
ข้อกำหนดด้านข้อมูล
แท่งเท่านั้น
ข้อมูล Tick
ปริมาณ
สัญญาณที่รองรับ
ความแข็งแกร่งของแนวโน้ม
ความผันผวน
Reversal
Breakout
Range ณ เวลาที่เปิดเซสชัน
แตะ Level ที่ระบุ
เบรก Level ที่ระบุ
Cross

รีวิวจากลูกค้า

0.0
รีวิว: 0
รีวิวจากลูกค้า
ยังไม่มีรีวิวสำหรับผลิตภัณฑ์นี้ หากเคยลองแล้ว ขอเชิญมาเป็นคนแรกที่บอกคนอื่น!

การสนทนา

คำถามที่พบบ่อย

Key Levels
Imbalance
Volume
ผลิตภัณฑ์ที่มีให้บริการผ่าน cTrader Store รวมถึงบอทการเทรด อินดิเคเตอร์ และปลั๊กอิน มีให้บริการโดยนักพัฒนาบุคคลที่สามและมีไว้เพื่อวัตถุประสงค์ในการเข้าถึงข้อมูลและทางเทคนิคเท่านั้น cTrader Store ไม่ใช่โบรกเกอร์และไม่ได้ให้คำแนะนำการลงทุน คำแนะนำส่วนบุคคล หรือการรับประกันผลการดำเนินงานในอนาคต

เพิ่มเติมจากผู้เขียนคนนี้

อินดิเคเตอร์
ATR
RSI
+5
Free swing detector with Fibonacci retracement and RSI overlay. Auto-deviation adapts to any timeframe
cBot
ATR
Wedge
+5
15 YEARS RESULTS :Win rate:93% | ROI+19000% | Trades:87,000 | Profit Factor 1.2 | Currency Pairs:22 | $10k to 500k$ |
1.2
อัตราส่วน กำไรต่อขาดทุน
อินดิเคเตอร์
ATR
BOS
+5
Heat intensity mapping of structural participation. See where price fights, where it accepts, and where it rejects .
อินดิเคเตอร์
RSI
Volume
+3
Auto-detects swings, Includes POC, Value Area (VAH/VAL), High Volume Nodes (HVN), Fibonacci retracement, and RSI overlay

นอกจากนี้คุณยังอาจชอบ

"Supply&Demand" โลโก้
ยอดนิยม
4.8
(5)
$19
/
$20
อินดิเคเตอร์
RSI
MACD
+1
Precision Supply & Demand zones indicator—automatically plots key buy/sell areas on your chart for smarter entries.
อินดิเคเตอร์
Customize your Moving Average! Choose any timeframe and price source for precision and flexibility in your analysis.
"rvwap v1" โลโก้
เรตติ้งสูง
4.6
(5)
$19
อินดิเคเตอร์
Prop
VWAP
+13
Rolling VWAP with dynamic or fixed time window, customizable source price and standard deviation bands.
อินดิเคเตอร์
Supply & Demand
Support & Resistance
RAF Supply Demand Lite v1.0 automatically detects clean Supply and Demand zones using confirmed swing highs and lows. Zo
"Zig zag v.1" โลโก้
ยอดนิยม
4.0
(2)
$19
/
$30
อินดิเคเตอร์
ZigZag Pro – Multi-Swing Indicator for cTrader Description: ZigZag Pro is a powerful and fully customizable swing indica
"Parabolic SAR Alert" โลโก้
ยอดนิยม
5.0
(6)
$19
อินดิเคเตอร์
Parabolic SAR Alert - Trend reversal alerts with smart signals & custom alerts.
อินดิเคเตอร์
Key Levels
Order Block
+2
It monitors trend lines on price charts and fires multi-channel alerts and optionally places trades when price crosses..
อินดิเคเตอร์
Key Levels
Spots key hourly ranges and signals breakouts using arrows & colored background zones. Ideal for Gold.
อินดิเคเตอร์
BOS
MSS
+5
One indicator, full ICT/SMC picture — structure, OBs, FVGs, liquidity, Premium/Discount — with graded PRIME/SETUP signal
อินดิเคเตอร์
Crypto
Signal
+3
Candlestick Signal Finder: cTrader indicator that automatically detects and color-codes key Japanese candlestick pattern
"Average Cost Price" โลโก้
เรตติ้งสูง
4.5
(4)
$25
/
$39
อินดิเคเตอร์
Prop
Forex
+9
Average Cost Price helps you keep track of your open positions on the chart. In doing so, it provides lines and explanat
อินดิเคเตอร์
AI
Grid
+9
Pivot Point MultiTimeFrame with Order Block
อินดิเคเตอร์
The long awaited new and improved Supply Demand Premium V2 indicator. Unlock greater trading opportunities now!
อินดิเคเตอร์
Spread Filter
SpreadSync Entry Timer is a compact cTrader indicator that shows live spread and candle-close.
อินดิเคเตอร์
Pin Bar
Inducement
+5
Institutional Nasdaq Session Liquidity Map with Live Point HUD, Sweep Alerts & Interactive Playbook.
อินดิเคเตอร์
Customizable window inside your platform, access to any website Calendar
อินดิเคเตอร์
Key Levels
Support & Resistance
Draws a colored High/Low/Open/Close box for any custom time range you set — trade breakouts & retests.
อินดิเคเตอร์
AI-assisted
Order Block
+5
The daily bias estimator indicator uses ICT concepts to show whether the chart is bullish or bearish on multi-time frame

ราคา

ตั้งแต่ 14/01/2025
2
การขาย
143
ติดตั้งฟรี




























