

Description
DONCHIAN MARKET & TREND INTELLIGENCE (cTRADER EDITION)
The Institutional Market State, Volatility Diagnostics & Multi-Horizon Trend Engine for cTrader
STOP GUESSING. START TRADING WITH QUANTITATIVE PRECISION.
Most breakout signals fail because standard indicators treat every price spike the exact same way.
This engine measures volatility compression, structural trend alignment, and real order-flow follow-through before you risk a single dollar.
Know in under three seconds whether a move is genuine institutional expansion or an engineered liquidity trap.
Stop staring at blind, repainting channel lines.
Start trading with complete market intelligence.
WHY MOST TRADITIONAL INDICATORS FAIL YOU (AND DRAIN YOUR ACCOUNT)
You know the scenario all too well.
You sit at your screen, watching price aggressively push beyond an established high. Standard indicators flash green. You enter long. Three candles later, the momentum completely evaporates, price collapses back into the range, and your stop loss gets hit on a textbook fakeout.
Traditional indicators leave you flying blind:
- They lag by dozens of bars, alerting you only after the move is already exhausted.
- They repaint or dynamically move their thresholds mid-candle, shifting the goalposts when you need clarity most.
- They create chart clutter, forcing you to juggle 5 to 10 conflicting indicators that trigger analysis paralysis.
What if your chart ran a continuous, quantitative audit on every closed bar—measuring volatility velocity, true boundary clearance, and multi-horizon trend agreement automatically?
INTRODUCING YOUR ON-CHART QUANTITATIVE TERMINAL
Meet the Market & Trend Intelligence Engine (cTrader Edition).
This is a unified, institutional diagnostic terminal built natively inside cTrader, transforming raw price action into actionable market intelligence.
Rather than treating boundary lines as simple visual markers, this engine uses unshifted price boundaries strictly as a baseline helper—running advanced mathematical models across historical volatility percentiles, rate-of-change derivatives, directional efficiency, and structural momentum.
Think of it as an onboard flight computer and lie detector for your charts. It does not just show you where price is; it evaluates how price got there, whether volatility supports the expansion, and whether the underlying order flow possesses the structural power to sustain the move.
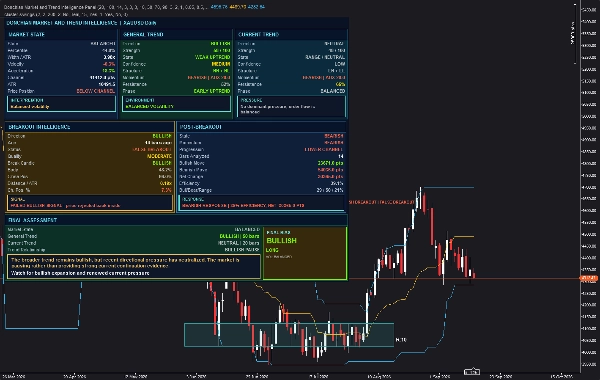
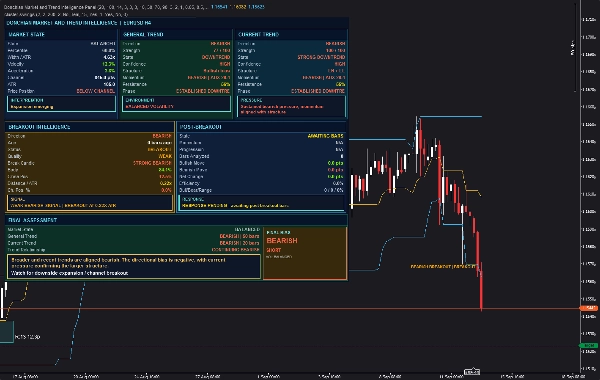
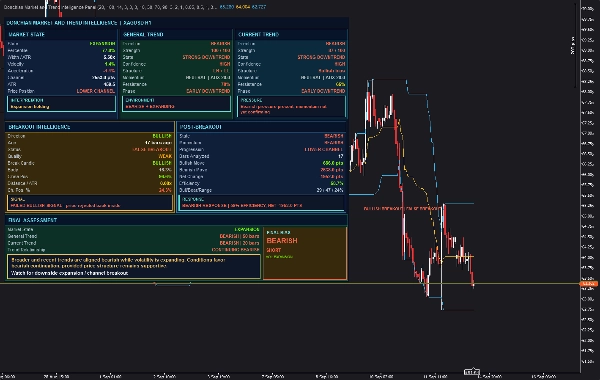
INSTANT 3-SECOND MARKET CLARITY: THE HEADS-UP DISPLAY (HUD)
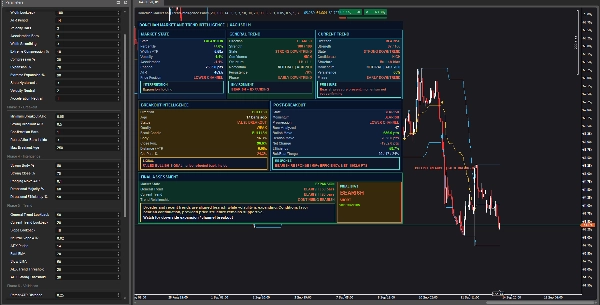
Designed natively for cTrader’s modern interface, the integrated HUD provides instant market diagnosis against any dark chart theme without cluttering your workspace.
text
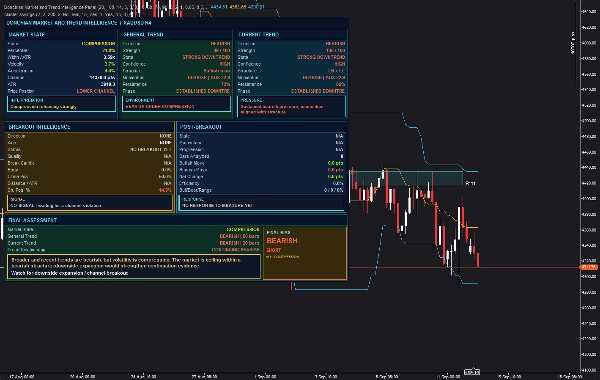
+----------------------------------------------------------------------------------------------------+| DONCHIAN MARKET AND TREND INTELLIGENCE | EURUSD H1 |+------------------------------------+-----------------------------------+---------------------------+| [ MARKET STATE ] | [ GENERAL TREND ] | [ CURRENT TREND ] || State: EXTREME COMPRESSION | Direction: BULLISH | Direction: BULLISH || Percentile: 8.4% | Strength: 82 / 100 | Strength: 76 / 100 || Width/ATR: 3.12x | Confidence: HIGH | Confidence: HIGH || Velocity: +4.2% | Structure: HH + HL | Structure: HH + HL || Price Pos: UPPER CHANNEL | Momentum: BULLISH | ADX 32.4 | Momentum: BULLISH || > "Compression releasing strongly" | > "BULLISH UNDER COMPRESSION" | > "Sustained pressure" |+------------------------------------+-----------------------------------+---------------------------+| [ BREAKOUT INTELLIGENCE ] | [ POST-BREAKOUT METRICS ] || Status: VALID CONTINUATION | Age: 4 bars ago | Efficiency: 68.4% || Break Dist: 0.84x ATR | Quality: STRONG | Net Travel: +42.5 pts || Candle: STRONG BULLISH | Close Pos: 88.2% | Bull/Bear/R: 75/25/0 % || > STRONG BULLISH SIGNAL | VALID AT 0.84X ATR | > BULLISH RESPONSE |+------------------------------------------------------------------------+---------------------------+| [ FINAL ASSESSMENT ] | [ FINAL BIAS ] || Deduction: Broader and recent trends aligned. Volatility expanding. | BULLISH || Watch: Watch for sustained upside expansion and structural holds. | [ LONG BIAS ] |+------------------------------------------------------------------------+---------------------------+
- Macro Volatility Environment (Top-Left): Answers "What market regime are we in?" Evaluates historical compression percentiles and mathematical rate-of-change derivatives.
- Dual-Horizon Trend Matrix (Top-Right): Answers "Is the broad trend supporting immediate pressure?" Decouples macro structural swings from immediate momentum.
- Breakout & Execution Forensics (Middle Row): Answers "Is this move real or a trap?" Dissects candle body mechanics, displacement beyond unshifted price thresholds, and tracks post-breakout efficiency bar-by-bar.
- Actionable Tactical Synthesis (Bottom Row): Answers "What is the definitive trade bias right now?" Synthesizes complex multi-factor data into a plain-English deduction, an exact watch condition, and a high-conviction trade badge (LONG, SHORT, or SPLIT READ).
UNDER THE HOOD: 4 INSTITUTIONAL-GRADE ANALYTICAL ENGINES
1. THE VOLATILITY & REGIME COMPRESSION ENGINE
- Historical Volatility Percentile Scoring: Normalizes channel width against the Average True Range (ATR) across a customizable lookback (default: 100 bars) to compute an exact 0–100% volatility percentile. You instantly know whether the market is coiled in an EXTREME COMPRESSION squeeze or overextended in EXTREME EXPANSION.
- 1st & 2nd Derivative Dynamics (Velocity & Acceleration): Uses linear regression slopes to measure the speed (Velocity) and acceleration of volatility expansion. You spot coiling energy before the breakout occurs, catching the move as explosive kinetic momentum releases.
- Hysteresis-Stabilized Regime Classification: Employs mathematical hysteresis buffers (default: 3.0%) across state transitions to prevent rapid, distracting signal flipping during choppy conditions.
2. BREAKOUT FORENSICS & VALIDATION
- Strict Unshifted Prior-Bar Boundary Mechanics: Evaluates breakout events against extremes calculated strictly prior to the evaluated bar. This prevents the breakout candle from moving its own goalposts, preserving absolute mathematical integrity.
- ATR-Normalized Clearance Thresholds: Requires bar closes to exceed channel thresholds by an exact multiple of ATR (≥0.05×ATR≥0.05×ATR for qualification; ≥0.50×ATR≥0.50×ATR for strong classification), instantly filtering out negligible sub-pip noise.
- Automated False Breakout, Retest & Liquidity Sweep Detection: Actively tracks post-signal price action to categorize moves into VALID, RETESTED, SWEPT (wick rejection ≥35%≥35%), or FALSE BREAKOUT (price rejected back inside).
3. POST-BREAKOUT DRIFT & EFFICIENCY TRACKER
- Directional Displacement Efficiency Ratio: Measures the net distance gained relative to total gross price movement across all bars following a breakout. You can instantly distinguish clean institutional runs (≥50%≥50% efficiency) from choppy, low-probability distribution.
- Bar-by-Bar Composition Breakdown: Audits every subsequent bar as Bullish, Bearish, or Ranging, showing you whether buyers or sellers are maintaining persistent control candle after candle.
4. DUAL-HORIZON TREND & STRUCTURAL SCORING
- Decoupled Multi-Lookback Trend Assessment: Simultaneously audits broad market structure (General Trend, default: 50 bars) alongside immediate order flow (Current Trend, default: 20 bars) to keep you on the right side of macro flow.
- Multi-Factor Trend Scoring Matrix: Combines structural swing geometry (Higher Highs/Higher Lows vs Lower Highs/Lower Lows), ATR-normalized EMA slope, directional persistence, and ADX/DMS vector alignment into an objective 0–100 score.
BUILT WITH INSTITUTIONAL RIGOR: ZERO REPAINTING, ZERO COMPROMISES
- 100% Non-Repainting Execution: Core analytical algorithms execute on closed bars (
index - 1). What you see on historical charts matches live execution tick-for-tick. - Sub-Millisecond Native C# Architecture: Built cleanly for the cTrader API (.NET). No external DLLs, no cloud web requests, and zero chart lag.
- Tick-Sensitive Live Price Tracking: Analytical states remain locked to closed bars to eliminate false alarms, while price-position coordinates update dynamically on every live tick.
- Universal Instrument Compatibility: Automatically scales across Forex, Crypto, Indices, Metals, and Energies via native tick-size and ATR normalization.
- Persistent Event Lifecycle Memory: Intelligently tracks, confirms, and retires breakout cycles, rescanning only fresh price history upon event invalidation.
- Instant Native Alerts: Receive real-time pop-up notifications and directional audio cues when valid setups occur.
4 HIGH-PROBABILITY TRADING PLAYBOOKS YOU CAN USE TODAY
- Playbook 1: The Volatility Squeeze Expansion
The Setup: Price has consolidated for hours. The dashboard displays EXTREME COMPRESSION (Percentile < 10%) with Velocity and Acceleration turning positive.
The Action: You prepare for explosive expansion. When a bar closes outside the prior boundary with a STRONG BULLISH candle and clearance >0.50×ATR>0.50×ATR, you enter long early—riding the surge while others are still waiting for confirmation. - Playbook 2: Filtering the Institutional Liquidity Sweep
The Setup: Price pierces resistance, but the breakout candle prints a long upper wick (≥35%≥35% of total range). On the next bar, the engine flags the status as SWEPT and price closes back inside the channel.
The Action: Instead of getting trapped buying the top, you avoid the long trade entirely—or execute a swift counter-trend short back toward the median. - Playbook 3: The Multi-Horizon Trend Retest
The Setup: General Trend shows STRONG UPTREND (Score > 80/100, High Confidence), while Current Trend shows a temporary BEARISH PULLBACK. Price pulls back to the upper boundary, holds without closing inside, and the dashboard flashes RETESTED.
The Action: You execute a high-conviction continuation entry aligned with the dominant macro trend with a defined, tight invalidation level. - Playbook 4: The Breakout Health & Momentum Audit
The Setup: You are short following a breakdown. Five bars later, the Post-Breakout panel shows Efficiency: 78%, Bearish Move: 85%, and Progression: LOWER CHANNEL.
The Action: The engine confirms strong follow-through and zero opposing friction. You let your winners run with complete confidence instead of closing prematurely.
FROM CHART OPEN TO HIGH-CONVICTION TRADE IN 5 SIMPLE STEPS
- Check the Market State: Look at the top-left panel. Are we in Compression (coiling), Expansion (active trend), or Balanced conditions?
- Confirm Multi-Horizon Alignment: Check General and Current Trend panels. Are both horizons flashing the same color and showing High Confidence?
- Inspect Breakout Quality: When price tests a boundary, check the Breakout Intelligence panel. Verify the candle structure, ATR clearance distance, and ensure status is VALID (not SWEPT or FALSE).
- Audit Follow-Through Efficiency: Review the Post-Breakout panel. Look for an Efficiency score ≥50%≥50% to confirm institutional commitment.
- Read the Final Bias: Check the Final Assessment card for your trade direction (LONG / SHORT), read the tactical deduction, and execute with disciplined risk management.
FULLY OPTIMIZED OUT OF THE BOX — CUSTOMIZABLE FOR ANY STYLE
Default parameters are quantitatively calibrated for institutional-grade market analysis on standard H1/H4 timeframes. Fine-tune any setting to match your specific asset class or trading style:
- Boundary Baseline Settings: Adjust baseline reference lookback (Default:
20). - Volatility & Regime Parameters: Configure historical percentile lookback (
100), smoothing (3), ATR periods (14), derivative lookbacks (3), and compression/expansion thresholds (10%,30%,70%,90%with3.0%hysteresis). - Breakout & Candle Forensics: Set ATR qualification multiples (Minimum:
0.05x, Strong:0.50x), confirmation rules (1 bar), retirement horizons (3 bars inside), and candle body strength filters (60% body,75% close position). - Trend Scoring & Structural Calibration: Customize macro lookback (
50), micro lookback (20), ADX thresholds (20.0/30.0), dual EMA smoothing (20/50), and sweep wick sensitivity (35%). - Visual HUD Customization & Alerts: Adjust dashboard corner placement (TopLeft, TopRight, BottomLeft, BottomRight), panel width, font scaling, insight text wrapping, chart labels, and audio/pop-up alerts.
WHAT YOU RECEIVE TODAY: COMPLETE TRADING SUITE & FREE STRATEGY GUIDE
- Full Access to the Market & Trend Intelligence Indicator for cTrader (.NET)
- FREE BONUS: The Complete Strategy & Usage Guidebook (PDF)
Included free with every purchase. This comprehensive guide walks you through complete setup blueprints, volatility cycle playbooks, false-breakout reversal models, and step-by-step parameter tuning for different asset classes. - Lifetime Updates & Enhancements: All future improvements and optimizations are included at no extra cost.
- Dedicated Developer Support: Direct assistance for setup, configuration, and feature inquiries.
UPGRADE YOUR cTRADER WORKSPACE TODAY
Markets do not wait for you to feel ready.
Every single trading session, capital is transferred from retail traders guessing on cluttered charts to disciplined traders utilizing objective, multi-factor market intelligence.
You can continue struggling with repainting indicators, conflicting signals, and frustrating false breakouts. Or you can equip your cTrader platform with an institutional-grade intelligence engine that decodes volatility, validates breakouts, and quantifies trend structure on every single bar.
Click "Buy" to get instant access, download your Free Strategy Guidebook, and elevate your cTrader charts to an institutional standard today.
cTrader Indicator | Market Intelligence Engine | Volatility Compression Detector | Breakout Confirmation Tool | Non-Repainting Trend Dashboard | Multi-Timeframe Trend Analysis | ATR Volatility Filter | Liquidity Sweep Detector | Price Action Forensics | Institutional Trading Terminal
Summary
Key features include a dual-horizon trend matrix that decouples broad market structure from immediate momentum, breakout forensics that validate moves against strict prior-bar boundaries and ATR-normalized thresholds, and a post-breakout drift tracker measuring directional efficiency and bar-by-bar control. The dashboard synthesizes these data points into a clear final trade bias with actionable insights.
The tool supports universal instrument compatibility across Forex, Crypto, Indices, Metals, and Energies, and offers customizable parameters for boundary lookbacks, volatility thresholds, breakout criteria, and trend scoring. It provides a native, non-repainting C# implementation optimized for cTrader, featuring a clean heads-up display (HUD) with real-time updates and native alerts.
Included are four high-probability trading playbooks addressing volatility squeeze expansions, liquidity sweeps, multi-horizon trend retests, and breakout momentum audits, plus a comprehensive strategy guidebook. This indicator transforms raw price action into quantitative market intelligence to assist traders in making informed decisions.
















!["Session Volume Profile (SVP) [Iridio Capital]" logo](https://cdn.ctrader.com/image/webp/b058beb7-b143-45f3-87d0-8c524c00b203_61552)









