
Description
Market Cipher A is an advanced technical indicator designed for easy analysis, identification, and prediction of macro trends in the cryptocurrency market.
Structure and Components
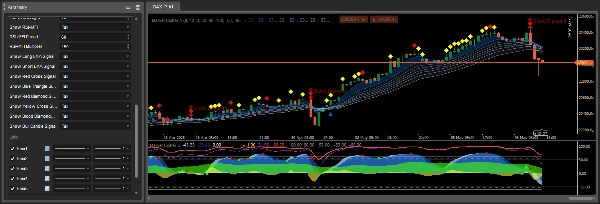
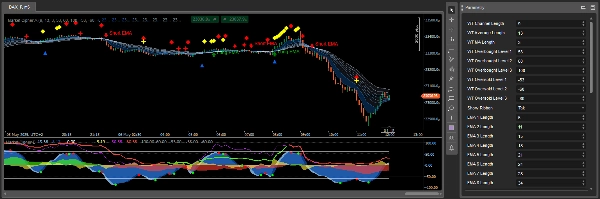
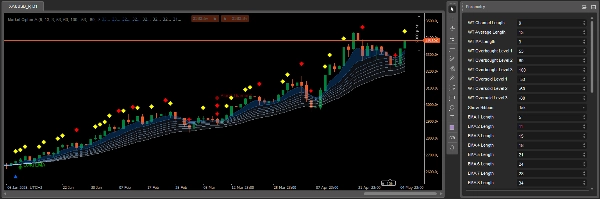
Market Cipher A consists of a ribbon of 8 exponential moving averages (EMA) that change color depending on the market trend. The EMA ribbon turns blue or white during a bull market and gray during a bear market.
By default, moving averages with EMA values from 5 to 34 are used. Crossovers of these lines can be very strong lagging indicators, which is why Market Cipher A has been programmed to automatically display symbols corresponding to different signals, eliminating the need for manual interpretation of each bullish or bearish crossover.
Symbols and Trading Signals
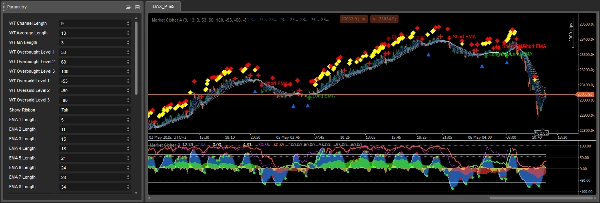
Market Cipher A displays characteristic symbols directly on the candlestick chart that indicate potential trading opportunities:
Blue Triangle - trend reversal signal, indicates declining momentum and an approaching reversal. It's an early warning that the trend's momentum is decreasing.
Green Circle - bullish indicator, most reliable on 6-hour timeframes and higher. Typically appears after a blue triangle and should be interpreted within a range of 1-3 candles.
Yellow Diamonds - indicate continuation of an upward trend. Should be used together with the EMA ribbon for better confirmation of trend direction.
Red Diamonds - signal trend weakening and possible downward continuation. Indicate increased downside momentum.
Red X - bearish indicator, most effective on 1-hour timeframes and higher. Should be used together with the EMA ribbon and red diamond.
Yellow X - indicates market manipulation, particularly large long position covering that is quickly bought up and sold by short positions.
Large Red Diamond (Blood Diamond) - the most bearish signal, indicating high probability of a decline, especially when occurring together with a red X or smaller red diamond.
Usage Principles
Market Cipher A provides strong mathematical support or resistance visually, enabling easy understanding of the trading environment. It works best with Heiken Ashi candles.
The EMA ribbon not only indicates the trend but also acts as dynamic support and resistance levels. When the ribbon is blue/white and candles are above it, you can look for opportunities to take long positions. When the ribbon is gray and candles are below it, you can consider short positions.
Best results are achieved when signals from Market Cipher A are combined with other indicators from the Market Cipher package, particularly Market Cipher B, which provides additional momentum signals and entry points.
Detailed Signal Interpretation in Trend Context
An important aspect of Market Cipher A is contextual signal interpretation depending on the dominant trend. When the ribbon changes color from gray to blue, the indicator generates a green circle as a signal for the start of an upward trend. Normally, after a green circle, if the next 1-3 candles display a yellow diamond, the probability of a breakout is high. However, if red diamonds appear, a breakout is less likely.
During a bull market, yellow diamonds are favorable, showing upward continuation aligned with the trend, while red diamonds represent a counter-trend move. In a bear market, the situation is reversed - red diamonds are favorable as a continuation of the decline, and yellow diamonds indicate a temporary upward move contrary to the trend.
The red X is most reliable when it appears after a red diamond and the EMA ribbon is almost completely constricted, changing color to bearish gray. The accuracy of this indicator varies depending on the timeframe.
Mechanism of Operation and Signal Genesis
The symbols and signals in Market Cipher A are generated based on several sources: WaveTrend wave crossovers, overbought and oversold levels, and based on RSI and MFI when they cross the center line or reach overbought and oversold conditions. This multidimensional analysis makes the signals more comprehensive than single indicators.
The EMA ribbon consists of 8 moving averages that form a characteristic ribbon with separation between individual bands. The separation of bands is an important factor - wide separation indicates a strong trend, while constricted bands suggest weakening momentum or consolidation.
Practical Application in Trading Strategies
Market Cipher A was designed primarily as a trend analysis tool, so it works best in trend-following strategies. It's recommended to use the ribbon together with other trend identification indicators, then look for trading opportunities during price pullbacks.
It's important to remember that these signals help fine-tune the timing of entry or exit from trades, but should not be used alone to make trading decisions. Additional confirmations are needed, especially for reversal signals that occur during flat price movements.
Summary
The indicator automatically displays distinct symbols on the price chart to signal potential trading opportunities:
- Blue Triangle: signals declining momentum and possible trend reversal.
- Green Circle: indicates a bullish trend start, most reliable on 6-hour timeframes and above.
- Yellow Diamonds: suggest continuation of an upward trend.
- Red Diamonds: indicate trend weakening and potential downward continuation.
- Red X: bearish signal effective on 1-hour timeframes and higher.
- Yellow X: points to market manipulation events.
- Large Red Diamond ("Blood Diamond"): strong bearish signal with high probability of decline.
Signals are generated using a combination of WaveTrend crossovers, RSI, and MFI indicators, providing multidimensional market analysis. Market Cipher A is optimized for use with Heiken Ashi candles and is best applied within trend-following strategies, ideally combined with other Market Cipher indicators for enhanced entry and momentum confirmation.
Customer reviews
5 | 67 % | |
4 | 33 % | |
3 | 0 % | |
2 | 0 % | |
1 | 0 % |


