
Supertrend Indicator v1.1
Indicator
32 purchases
Version 1.2, Feb 2026
Windows, Mac
4.3
Reviews: 3
Description
Showcase:
Supertrend Indicator – an essential tool for traders that makes it easy to ride market trends and make smarter investment decisions! This intuitive, professional-grade indicator is designed to deliver crystal-clear buy and sell signals, whether you’re just starting out or are an experienced investor.
Why Choose the Supertrend Indicator?
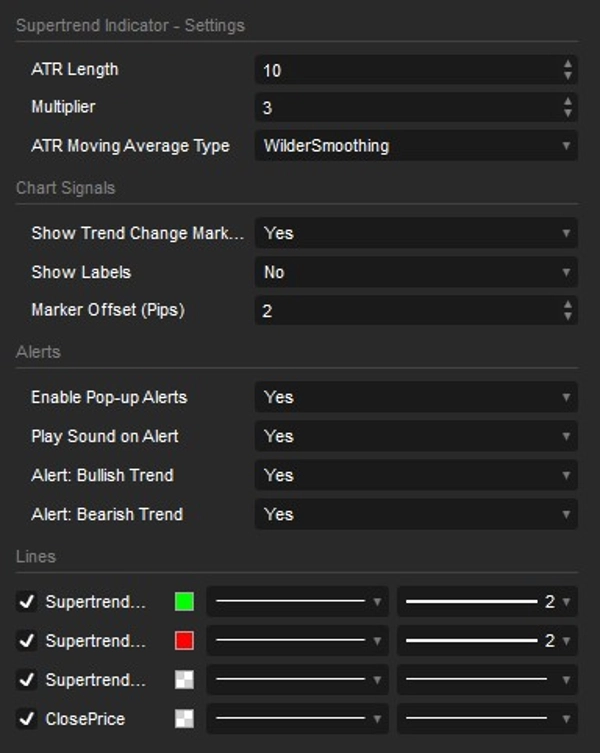
- Industry-Standard Accuracy: Now featuring customizable ATR Moving Average Types (including Wilder's Smoothing). It calculates and reacts exactly like the most popular premium Supertrend versions found on top charting platforms like TradingView!
- 100% Non-Repainting: Built with a rock-solid trend memory mechanism. Once a trend shifts and a signal is printed, it stays there. No repainting, no disappearing arrows, and no recalculation errors when scrolling through chart history.
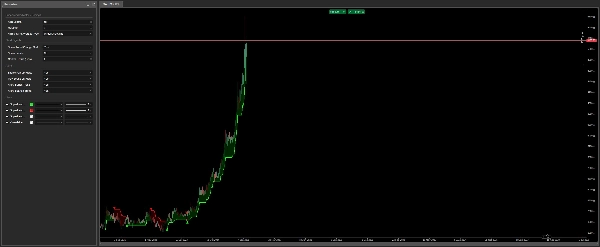
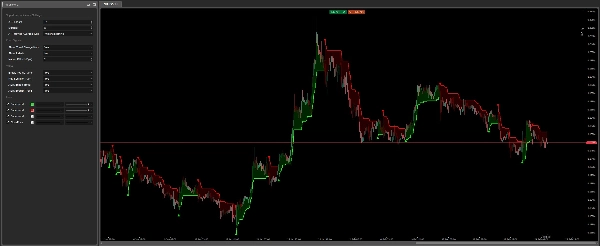
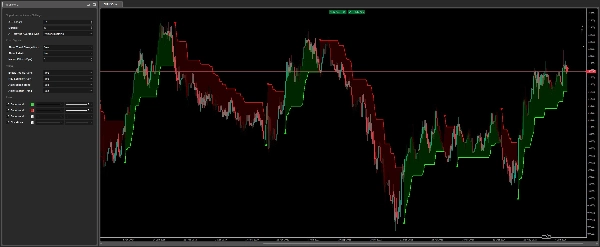
- Simplicity and Effectiveness: The indicator automatically draws a Supertrend line that turns green when the market is rising (buy signal) and red when it’s falling (sell signal). You’ll always know exactly which way the trend is heading.
- Smart Real-Time Notifications: Never miss a trading opportunity! The indicator features an upgraded alert system utilizing native cTrader Pop-ups and integrated sound effects. Plus, with built-in spam protection, you are alerted exactly once when a real-time signal occurs—no annoying sound spam when loading or reloading charts.
- Enhanced Visual Signals & Cloud Fill: At every key trend change, you’ll see eye-catching arrows and optional "Bullish"/"Bearish" text labels. A subtle, dynamic cloud fill between the Supertrend line and the price helps you easily grasp market momentum at a glance.
- Fully Customizable & Precise: Easily adjust core settings like the ATR Length and Multiplier. You can also precisely control the distance of arrows and labels using dynamic Pip-based offsets, ensuring perfect, uncluttered visuals on any asset.
Supertrend Indicator is perfect for anyone looking to simplify market analysis – from beginner traders seeking an easy way to spot trends, to seasoned professionals wanting highly precise, non-repainting signals for their strategies. It works flawlessly on any market – Forex, Stocks, Indices, Cryptocurrencies – and across all timeframes.
Summary
AI summary
The Supertrend Indicator v1.1 is a professional-grade trading tool designed to identify market trends and provide clear buy and sell signals. It features customizable ATR moving average types, including Wilder's smoothing, ensuring accuracy comparable to leading platforms. The indicator is 100% non-repainting, maintaining stable signals without recalculation errors or disappearing markers. It visually represents trends with a line that turns green during upward movements and red during downward trends, complemented by arrows, optional "Bullish"/"Bearish" labels, and a dynamic cloud fill to highlight market momentum. Real-time alerts use native cTrader pop-ups and sound effects with built-in spam protection, notifying users once per signal. Users can adjust key parameters such as ATR length, multiplier, and visual offsets for precise, uncluttered display across all asset types. The Supertrend Indicator supports multiple markets including Forex, Stocks, Indices, and Cryptocurrencies, and is suitable for all timeframes. It is designed for traders of all experience levels seeking a reliable, easy-to-interpret trend analysis tool.
Indicator profile
Customer reviews
4.3
Reviews: 3
5 | 33 % | |
4 | 67 % | |
3 | 0 % | |
2 | 0 % | |
1 | 0 % |
Customer reviews
November 4, 2025
Smooth and steady - Supertrend v1.1 keeps you riding the trend with confidence. Clear color switches show when momentum flips, helping you enter early and exit smart. Fast, reliable, and a classic trend tool that belongs in every trader’s arsenal. Pairs perfectly with momentum filters or ATR-based setups for precision entries!
August 6, 2025
Discussion
FAQ
Signal
Indices
Commodities
GBPUSD
RSI
Bollinger
Fibonacci
Scalping
AI
XAUUSD
NAS100
MACD
BTCUSD
Forex
Breakout
EURUSD
NZDUSD
Martingale
Prop
ZigZag
Supertrend
Fair Value Gap
SMC
Crypto
Grid
Stocks
ATR
USDJPY
VWAP
Products available through cTrader Store, including trading bots, indicators and plugins, are provided by third-party developers and made available for informational and technical access purposes only. cTrader Store is not a broker and does not provide investment advice, personal recommendations or any guarantee of future performance.


Price
87
Sales
147
Free installs