
SessionPowerZonesPro
Indicator
4 purchases
Version 1.0, Jul 2025
Windows, Mac
5.0
Reviews: 2
Description
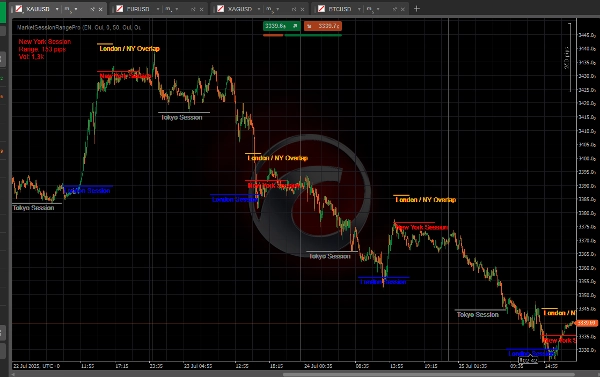
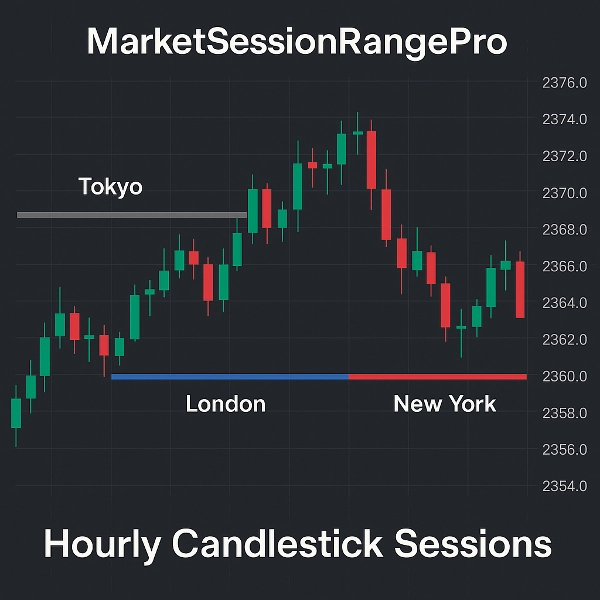
Session Power Zones PRO is a powerful market session visualization tool designed for traders who want absolute clarity during key trading hours. It automatically draws horizontal session zones (Tokyo, London, New York, Sydney, and the London/NY Overlap) directly on your chart, with full customization.
🔹 Key Features:
- Display Tokyo, London, New York, Sydney, and London/NY Overlap zones
- Dynamic range (pips) and average volume statistics for the current session
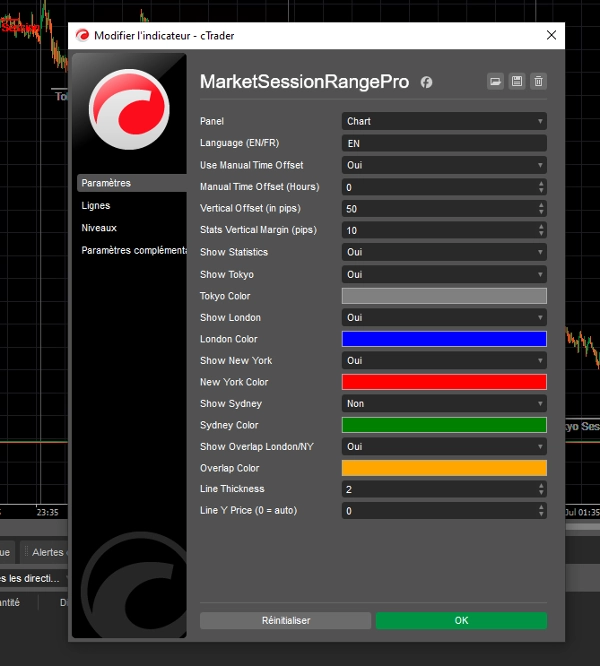
- Parametrable: time offsets, colors, vertical spacing, and text positioning
- Smart layout: avoids overlapping labels and displays only active session stats
- Multilingual support: English / French
- Lightweight and fast on all timeframes – ideal for scalpers and intraday traders
Designed to highlight when to trade, not just where price is.
Boost your strategy with clear, clean session power zones.
Summary
AI summary
Session Power Zones PRO is a market session visualization indicator designed for traders seeking clear insights during key trading hours. It automatically plots horizontal zones for major market sessions—Tokyo, London, New York, Sydney—and the London/New York overlap directly on the chart. The tool provides dynamic real-time statistics including range in pips and average volume for the current session, aiding in identifying optimal trading times. Users can customize time offsets, colors, vertical spacing, and text positioning to suit their preferences. The indicator features a smart layout that prevents label overlap and displays only active session data. It supports English and French languages and operates efficiently across all timeframes, making it suitable for scalpers and intraday traders. The focus is on highlighting when to trade by emphasizing session power zones rather than just price levels.
Indicator profile
Customer reviews
5.0
Reviews: 2
5 | 100 % | |
4 | 0 % | |
3 | 0 % | |
2 | 0 % | |
1 | 0 % |
Customer reviews
August 8, 2025
The strongest use case is the trade rules stay clearer, and the first read should come from several signals.
August 1, 2025
the part worth keeping is the setup needs less second guessing, and the first 10 trades should stay boring.
Discussion
FAQ
Products available through cTrader Store, including trading bots, indicators and plugins, are provided by third-party developers and made available for informational and technical access purposes only. cTrader Store is not a broker and does not provide investment advice, personal recommendations or any guarantee of future performance.


Price
Since 19/01/2025
6.83M
Traded volume
241.62K
Pips won
110
Sales
3.21K
Free installs