Brokers & props
For business
00
Days
:
00
Hours
:
00
Minutes
:
00
Seconds
Indicator
NAS100
RSI
NZDUSD
XAUUSD
Commodities
Forex
Signal
EURUSD
GBPUSD
BTCUSD
Indices
ATR
Stocks
Crypto
USDJPY
Scalping
Multi Timeframe Trend Scanner
5.0
16/11/2025
99
Desktop
Since 19/01/2025
Traded volume
6.83M
Pips won
241.62K
Sales
16
Free installs
411
"Multi Timeframe Trend Scanner" uploaded image"Multi Timeframe Trend Scanner" uploaded image"Multi Timeframe Trend Scanner" uploaded image"Multi Timeframe Trend Scanner" uploaded image

Multi Timeframe Trend Scanner – Read The Full Market Story At A Glance

Multi Timeframe Trend Scanner gives you a clean, compact view of the trend across multiple timeframes directly on your cTrader chart – from M5 up to D1 – plus a clear overall trading bias:
➡️ Strong BUY / BUY / NEUTRAL / SELL / Strong SELL

Instead of jumping between charts and guessing, you get a structured multi-timeframe trend map in one place.


🧠 Smart Trend Score Engine

For each enabled timeframe (M5, M15, M30, H1, H4, D1), the indicator calculates a robust trend score using three key components:

  • 📈 EMA (trend direction & slope)
    • Price vs EMA (above/below)
    • EMA slope (rising/falling)
  • 💪 RSI (momentum)
    • Normalised around the 50 level
  • 🌊 ATR (optional volatility filter)
    • Optionally ignore ultra-low volatility conditions

Each timeframe gets a score in the range -100 to +100, then translated into an easy state:

  • 🟢 UP – bullish bias
  • 🔴 DOWN – bearish bias
  • 🟡 FLAT – sideway / unclear

You instantly see which timeframes agree and where the real directional bias is.


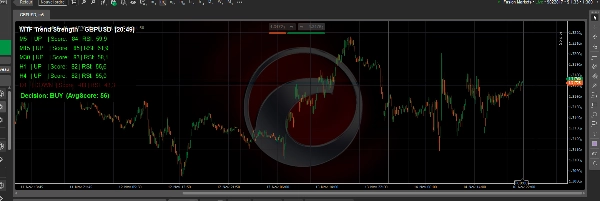
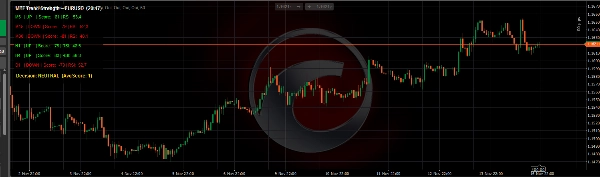
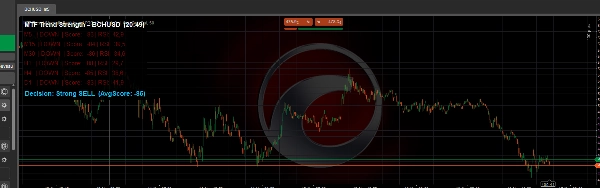
📊 Clean, Lightweight Dashboard on Chart

The tool draws a small UI panel on top of your chart, designed to be readable but not intrusive:

  • One line per timeframe, for example:
    M15 | UP | Score: 63 | RSI: 61.2
  • Color-coded:
    • Green for UP
    • Red for DOWN
    • Gold for FLAT
  • Panel can be placed in the top-left or top-right corner
  • Adjustable panel:
    • Background color & opacity
    • Font size
    • Line height
    • Bullish / bearish / neutral colors

Perfect for scalpers, day traders and swing traders who want to quickly confirm the bigger picture.


🧭 Global Trading Bias Line

At the bottom of the panel, Multi Timeframe Trend Scanner computes the average score of all active timeframes and turns it into a clear global bias:

  • Strong BUY – strong bullish alignment across timeframes
  • BUY – bullish bias, but not extreme
  • NEUTRAL – mixed or choppy market
  • SELL – bearish bias
  • Strong SELL – strong bearish alignment

This makes it ideal as a trend and direction filter for:

  • Manual trading (only trade in the direction of the bias)
  • Scalping entries with higher timeframe confirmation
  • Swing trading aligned with H1 / H4 / D1


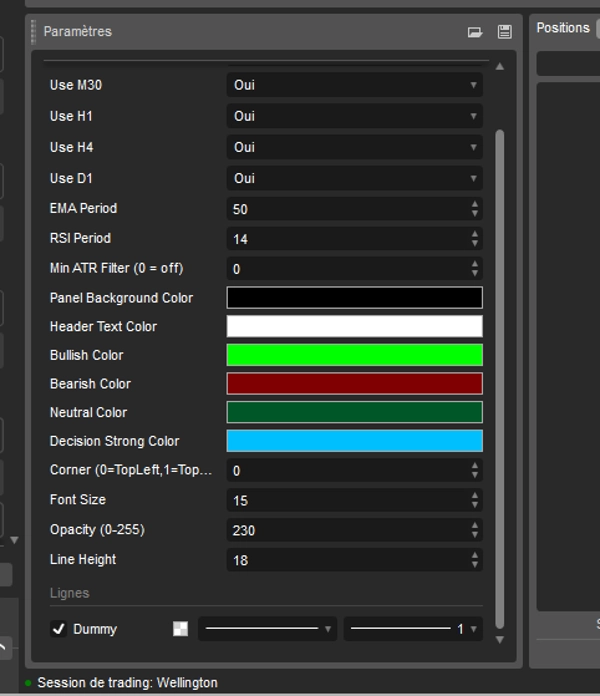
🔧 Fully Customisable

You keep full control over the logic and the look:

  • Enable/disable each timeframe (M5, M15, M30, H1, H4, D1)
  • Configure:
    • EMA Period (trend sensitivity)
    • RSI Period (momentum behaviour)
    • ATR minimum filter (0 = off)
  • Visual settings:
    • Panel background color & transparency
    • Header and line text colors
    • Bullish / bearish / neutral / strong-bias colors
    • Font size and line spacing

The indicator works on any symbol supported by cTrader: forex, indices, gold, crypto, stocks.


If you want a clear, objective and visual way to read trend alignment across multiple timeframes and quickly decide whether the market is better suited for buying, selling or staying aside, Multi Timeframe Trend Scanner is a powerful addition to your cTrader toolbox.

5.0
Reviews: 2
5
100 %
4
0 %
3
0 %
2
0 %
1
0 %
Customer reviews
November 25, 2025
This multi-timeframe trend scanner is honestly a game changer for my trading. It gives me a clear, structured view of the trend on several timeframes at once, so instead of jumping back and forth between charts, I can see everything in a single glance. It immediately shows whether the market is bullish, bearish, or ranging on each timeframe, which makes it much easier to align my entries with the dominant trend.
November 24, 2025
Multi Timeframe Trend Scanner gives you a clear dashboard of trend strength across multiple timeframes in one view. Perfect for aligning entries with bigger picture. Lightweight, visually intuitive, and highly customizable. A real asset for scalpers and swing traders alike. A few added alerts and advanced filters would take it further.
More from this author
cBot
RSI
Signal
Scalping
+1
HannibalScalpLiteAI
HannibalScalpLiteAI – A reliable scalping bot for EUR/USD (M1) using EMA, RSI, and COG indicators. Designed for simplici
SmartLiquidityZonesPRO
Smart Liquidity Zones PRO auto-detects liquidity grabs, wicks, traps & manipulations — trade like the smart money.
Indicator
Indices
Breakout
XAUUSD
+5
Price Action Context Scanner
Smart Price Action Scanner 🔍 Detects engulfing, pin bars & inside bars with trend filter for cleaner entries ✅
Indicator
Indices
RSI
XAUUSD
+8
DOMFlowScalperPRO
Scalp smarter with DOM Flow Scalper PRO – real-time Bid/Ask imbalance and volume precision!
Indicator
Grid
NAS100
RSI
+17
ScalpingSignalIndicator
Scalping signals with EMA/RSI/ATR logic. Visual cloud shows precise entry and exit zones. Built for M1/M5 scalpers.
SessionPowerZonesPro
Highlights market sessions & overlaps with real-time range & volume stats – perfect for pro scalpers.
cBot
RSI
Breakout
XAUUSD
+6
XAU Session Scalper Pro 1.0
XAU Session Trend Sniper ⚡️Gold M1 scalper with smart trend filter, ATR SL/TP & session logic – no grid, no martingale
cBot
RSI
ATR
Forex
+2
ForexFuryBot
Forex Fury M1 Bot is an advanced automated trading system designed to operate on the M1 timeframe
Indicator
Indices
RSI
Prop
+5
MultiScalpScorePRO
🔍 MultiScalpScorePRO – Powerful real-time scoring system combining indicators for ultra-precise scalping signals.
Indicator
NAS100
RSI
NZDUSD
+12
TrendMomentumScore
TrendMomentumScore_558: all-in-one EMA, MACD & RSI trend strength meter with clear -100 to +100 buy/sell zones.
cBot
Grid
RSI
XAUUSD
+6
Mr Krabs XAU
MR KRABS XAU 🦀🟡 — smart gold grid trading with ATR spacing, tight risk, and basket take-profit. 🎯
Indicator
Grid
NAS100
Breakout
+14
Dynamic ATR TPSL R-Multiple Helper
Plot ATR-based SL and 1R/2R/3R TPs instantly for any trade, with clear R-multiple risk mapping.
You may also like
Indicator
Indices
Prop
Breakout
+8
MarketRegimeAI
A cutting‑edge trading indicator that fuses AI and mathematics with adaptive logic to classify market regimes.
Indicator
Indices
Prop
Stocks
+3
VegaXLR - Unlimited Trendline Alerts
This is an indicator that can alert you about trendlines, horizontal lines and vertical lines.
Rsi Scalp Indi
RSI Scalper delivers split‑second entries on volatile assets.
Previous Day Equilibrium (Premium & Discount)
Plots the equilibrium price levels based on previous daily highs and lows.
Indicator
NAS100
NZDUSD
XAUUSD
+10
AutoFib Navigator
Automatically plots Daily and Weekly Fibonacci retracements with smart redraw and session control.
Indicator
NAS100
NZDUSD
Breakout
+13
KeyLevels
Key Levels Indicator – Automatically plots monthly, weekly, and daily highs/lows with customizable colors & styles
Premium Discount Zones
Premium Discount Zones" spots key areas (🟣Premium/🟢Discount) using recent highs/lows & volume..............
Indicator
Breakout
Bollinger
Pressure Scanner
Pressure Scanner is a volatility-and-momentum to show both pressure states (squeeze on/off) and directional
Indicator
Grid
NAS100
NZDUSD
+19
Dynamic-Swing-Anchored-Vwap
“Dynamic Swing VWAP — Structure-Anchored, Volatility-Adaptive, Market-Ready.” 🚀
Indicator
NZDUSD
Forex
EURUSD
+2
4 RCS Relative Strength w Alerts_NSC
Forex Strength Meter for cTrader: 4 custom currencies, cross alerts, visual arrows. Trade smarter!
Indicator
Indices
Breakout
XAUUSD
+5
Price Action Context Scanner
Smart Price Action Scanner 🔍 Detects engulfing, pin bars & inside bars with trend filter for cleaner entries ✅
Indicator
NAS100
NZDUSD
XAUUSD
+13
Keylevels v1.1
Refined cleaner version of Key Levels indicator with broker UTC offset, styles & label alignment.
Indicator
Indices
RSI
Signal
[Stellar Strategies] MARSI Signal Plotter
🚀📈 Plot buy/sell signals on Range Bars using Moving Averages and RSI. Clear, actionable trading insights.🚀📈
Indicator
Bollinger
Repiptor BB Width
Bollinger Bands Width
Indicator
Indices
RSI
Signal
+2
[Stellar Strategies] Ultimate Trend & Momentum Dashboard
A comprehensive cTrader indicator designed to give you a quick, at-a-glance understanding of market sentiment 📈📉
ms_Candle_ColseTime
⏱ Candle Time Remaining – Real-Time Candle Countdown Indicator
Indicator
Bollinger
Repiptor BB Colored Width
Colored Bollinger Bands Width
Indicator
Indices
RSI
ATR
+3
Divergency 1.1_withSourceCode
🔍 Divergence Indicator for cTrader (Update v1.1)