

OrderFlow Absorption Matrix
Indicator
1 purchases
Version 1.0, Jul 2026
Windows, Mac
Since 23/06/2025
1
Sales
Description
1️⃣ Order Flow & Delta Detection
- Lower Timeframe (LTF) Drilling: The indicator inspects lower-timeframe candle data (e.g., 1-minute bars) within each current bar to compute:
- Net Delta: The net difference between buying and selling volume.
- Absorption: Heavy volume traded at bar extremes that fails to push price further, signaling large passive limit orders absorbing market liquidity.
- Whale Print Detection: Utilizes dynamic Percentiles calculated across three distinct lookback windows (Short, Medium, Long) combined with a customizable Consensus Engine to isolate true institutional volume spikes.
2️⃣ Adaptive Volume Profile Engine
- Bin Segmentation: Segments the historical price range (Lookback Bars) into equal vertical price bins.
- Volume Distribution: Separates buy volume, sell volume, and delta per bin, rendering proportional horizontal profile bars on the right side of the chart.
- Dynamic Timeframe Handling: Instead of relying on fixed-second ticks, the indicator dynamically evaluates real bar spans (
GetCurrentBarSpan). This prevents profile collapse or line distortion across non-standard timeframes and market session breaks (such as stock market overnight gaps). - Value Area & POC Calculation:
- POC (Point of Control): Identifies the highest-volume price level and highlights it with a prominent anchor line.
- Value Area (VA): Dynamically isolates the core volume percentage (e.g., 70%) and draws the Value Area High (VAH) and Value Area Low (VAL).
3️⃣ Weighted Multi-Factor Zone Scoring System
Each price bin is continuously evaluated using a weighted multi-factor formula scored from 1 to 10:
Score=w1⋅Volume+w2⋅Absorption+w3⋅Touches+w4⋅Rejections+w5⋅Recency
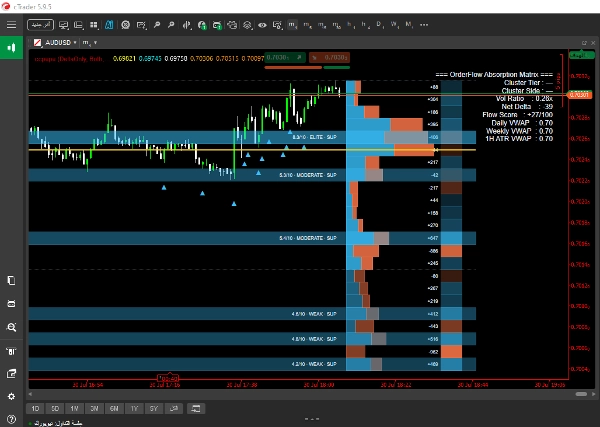
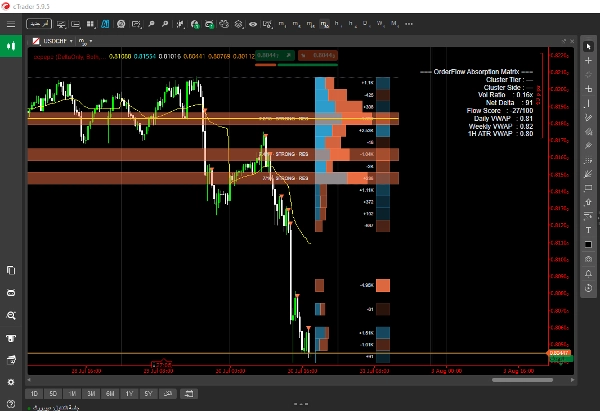
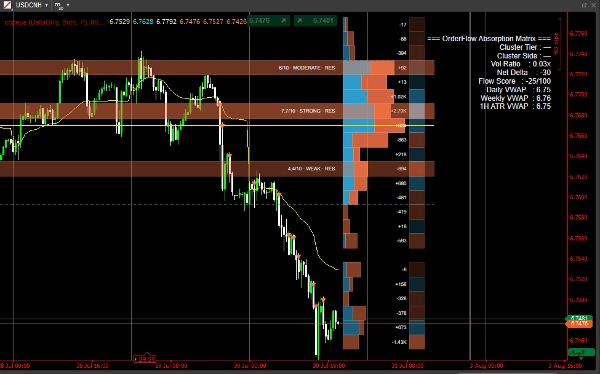
- Automated Zone Profiling: High-scoring levels (Elite or Strong) are projected onto the chart as dynamic support/resistance zones complete with real-time numeric strength badges.
4️⃣ Anchored VWAP Signals & Execution Triggers
- Calculates VWAP benchmark lines anchored to key temporal shifts (Start of Day, Week, and Month).
- Cross-analyzes price action relative to Anchored VWAPs alongside high-volume Cluster Triggers to plot precision entry arrows directly on the chart.
5️⃣ On-Screen Analytics Dashboard
A clean, real-time HUD positioned at any chart corner of your choice provides an immediate summary of market conditions:
- Cluster Tier: Current bar classification (Whale, Medium, Small).
- Cluster Side & Net Delta: Directional liquidity bias and precise delta numbers.
- Volume Ratio: Current volume relative to moving averages.
- Flow Score: A normalized momentum/order flow score ranging from −100 to +100.
- VWAP Benchmarks: Real-time values for active VWAP levels
Summary
AI summary
OrderFlow Absorption Matrix is an advanced indicator for cTrader that provides detailed order flow and volume profiling to identify institutional trading activity. It analyzes lower timeframe candle data to calculate net delta (buy vs. sell volume) and absorption, highlighting heavy volume at bar extremes where price fails to move further, indicating large passive limit orders. The indicator detects significant volume spikes ("Whale Prints") using dynamic percentiles across multiple lookback windows combined with a consensus engine.
It features an adaptive volume profile engine that segments historical price ranges into equal bins, displaying buy volume, sell volume, and delta per bin with proportional horizontal bars. The profile dynamically adjusts for varying timeframes and market session breaks, calculating key levels such as Point of Control (highest volume price) and Value Area (core volume range).
A weighted multi-factor scoring system continuously evaluates price bins based on volume, absorption, touches, rejections, and recency, projecting high-scoring zones as dynamic support/resistance levels with numeric strength indicators. Anchored VWAP lines are calculated for key time anchors (day, week, month) and combined with volume cluster triggers to plot precise entry signals.
An on-screen analytics dashboard provides real-time summaries including cluster tier classification, directional delta, volume ratios, momentum scores, and VWAP benchmarks, aiding in market condition assessment and trade decision-making.
It features an adaptive volume profile engine that segments historical price ranges into equal bins, displaying buy volume, sell volume, and delta per bin with proportional horizontal bars. The profile dynamically adjusts for varying timeframes and market session breaks, calculating key levels such as Point of Control (highest volume price) and Value Area (core volume range).
A weighted multi-factor scoring system continuously evaluates price bins based on volume, absorption, touches, rejections, and recency, projecting high-scoring zones as dynamic support/resistance levels with numeric strength indicators. Anchored VWAP lines are calculated for key time anchors (day, week, month) and combined with volume cluster triggers to plot precise entry signals.
An on-screen analytics dashboard provides real-time summaries including cluster tier classification, directional delta, volume ratios, momentum scores, and VWAP benchmarks, aiding in market condition assessment and trade decision-making.
Indicator profile
Indicator category
Statistics
Output type
Filter
Data requirements
Tick data
Supported signals
Level break
Level touch
Reversal
Divergence
Discussion
Customer reviews
0.0
Reviews: 0
Customer reviews
No reviews for this product yet. Already tried it? Be the first to tell others!
FAQ
Bollinger Bands
Key Levels
Volume
Supply & Demand
VWAP
Support & Resistance
Products available through cTrader Store, including trading bots, indicators and plugins, are provided by third-party developers and made available for informational and technical access purposes only. cTrader Store is not a broker and does not provide investment advice, personal recommendations or any guarantee of future performance.
More from this author


















Price
Since 23/06/2025
1
Sales