OR Session Zones
Indicator
Version 1.1, Dec 2025
Windows, Mac
4.5
Reviews: 2
Description
OR Session Zones — Multi‑Session Opening Range Indicator
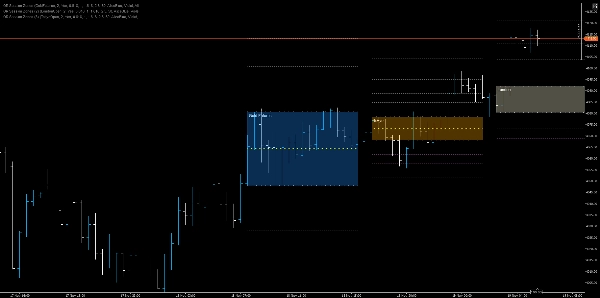
A high‑precision Opening Range indicator that detects session opens (NY, London, EU, Tokyo, Shanghai, Gold/Crude futures), draws dynamic OR high/low/mid zones, projects Fibonacci‑based targets, and paints a configurable shaded area for quick visual decisioning.
Key features
- Multi‑session detection: Native support for New York, London, EuroNext, Tokyo, Shanghai, Gold Futures, and Crude Futures opening bars using dedicated session indicators.
- Opening Range calculation: Computes OR High and OR Low from a configurable number of candles (RangeCandles) and records the session start time.
- Persistent chart overlays: Draws trendlines for OR High, OR Low, and OR Mid (50%) across the chart until a configurable extension time.
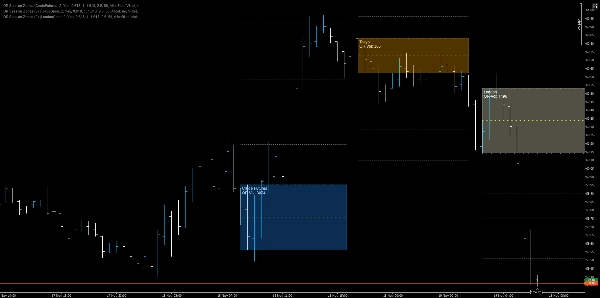
- Shaded zone: Filled rectangle between OR High and OR Low with configurable opacity and color per session for instant visual context.
- Fibonacci projections: Up to four R (resistance) and S (support) projection lines derived from the OR range with independent colors and adjustable opacity.
- Flexible visibility: Option to hide or render indexed (unique) object IDs to prevent collisions; supports both single persistent objects and per‑bar objects when Hide is toggled.
- Session color coding: Each session uses a distinct color scheme (e.g., DodgerBlue, LightYellow, Orange, OrangeRed) to make session origin immediately obvious.
How it helps traders
- Fast context: Instantly see where the market opened for a major session and understand early range structure without manual measurement.
- Decision triggers: Use OR breaks, midline rejections, and Fibonacci projections as entry/exit rules or stop placement anchors.
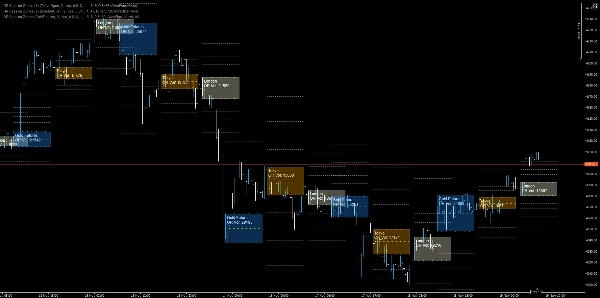
- Multi‑session strategy: Combine overlapping ORs (e.g., London + NY) to detect session confluence zones and higher‑probability trade areas.
- Risk management: Place stops behind OR stacks or use the mid‑50% as dynamic stop/take targets.
Usage scenarios and example rules
- Breakout entry: Buy on close above OR High with confirmation from volume or momentum; stop just below OR High (or OR Mid for tighter exits).
- Fade the open: Short near OR High with reversal confirmation if price fails to sustain above OR Mid and shows rapid pulling of bids.
- Session confluence trade: When London and NY ORs overlap, treat the overlap as a high‑confidence supply/demand zone and scale position size accordingly.
- Projection targets: Use R1/R2/R3/R4 as staggered take‑profit levels and S1 - S4 symmetrically for downside targets.
Summary
Indicator profile
Customer reviews
4.5
Reviews: 2
5 | 50 % | |
4 | 50 % | |
3 | 0 % | |
2 | 0 % | |
1 | 0 % |
Customer reviews
November 22, 2025
Solid enough as a backup opinion, and It can look better than it is during a lucky run.
November 19, 2025
Discussion
FAQ
Fibonacci
Forex
Breakout
Indices
EURUSD
Commodities
GBPUSD
XAUUSD
NAS100
Products available through cTrader Store, including trading bots, indicators and plugins, are provided by third-party developers and made available for informational and technical access purposes only. cTrader Store is not a broker and does not provide investment advice, personal recommendations or any guarantee of future performance.


Price
25
Sales
2.11K
Free installs