Brokers & props
For business
00
Days
:
00
Hours
:
00
Minutes
:
00
Seconds
Daily SD Levels - Indicator
"Daily SD Levels - Indicator" logo
Since 16/07/2025
Sales
3
"Daily SD Levels - Indicator" uploaded image"Daily SD Levels - Indicator" uploaded image"Daily SD Levels - Indicator" uploaded image"Daily SD Levels - Indicator" uploaded image

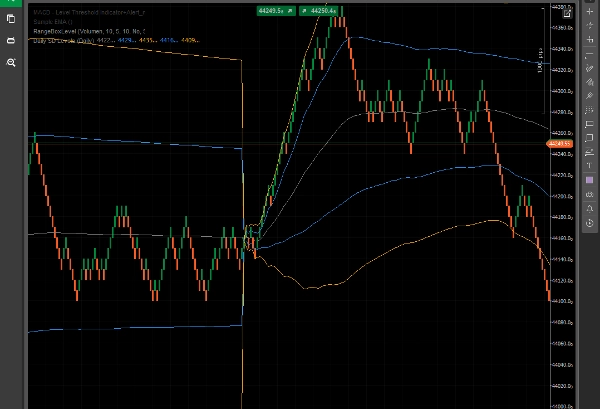
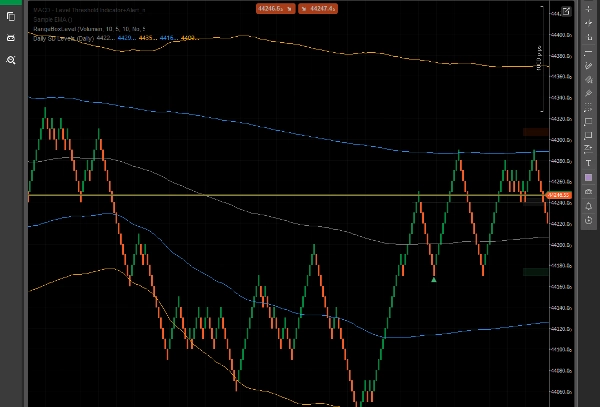
Daily SD Levels – Dynamic VWAP-Based Standard Deviation Bands

The Daily SD Levels indicator plots dynamic VWAP (Volume-Weighted Average Price) and Standard Deviation Bands (+1/+2 and -1/-2) calculated over the current trading day.

This tool helps traders visually assess intraday volatility, potential support/resistance zones, and price extremes, all based on actual market volume and price action – not fixed or arbitrary levels.


Key Features:

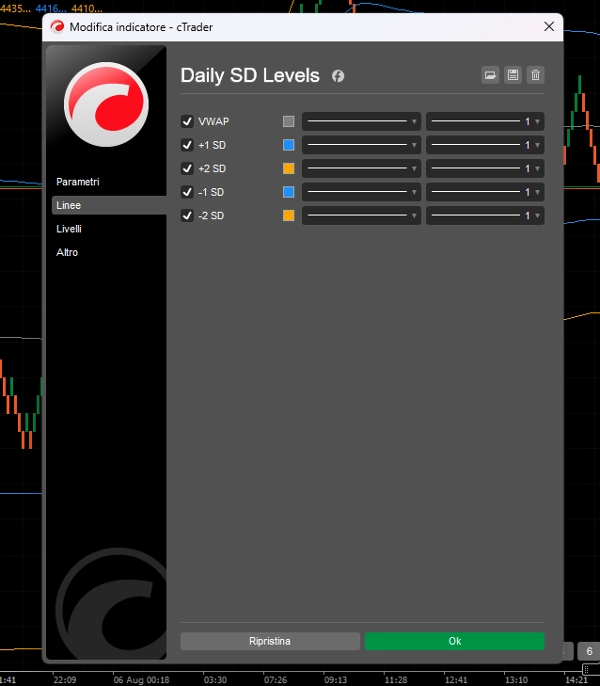
  • VWAP Line for intraday fair value tracking.
  • +1/+2 and -1/-2 SD Bands to identify overbought/oversold zones.
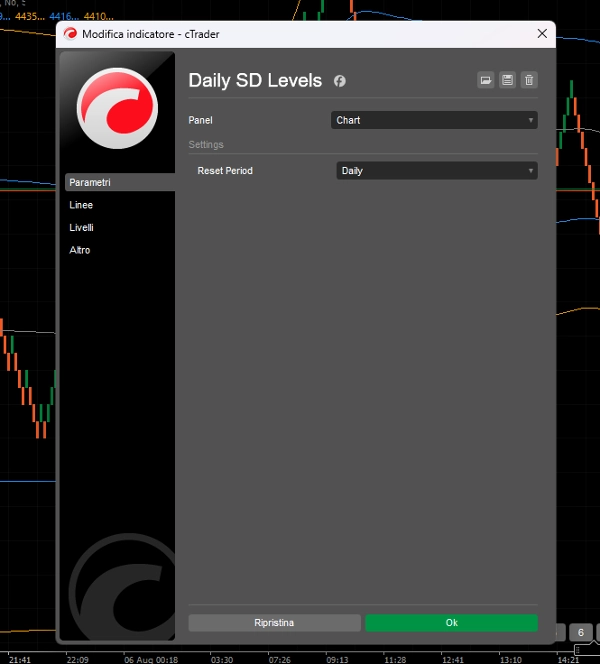
  • Levels reset daily, adapting to each session’s price and volume dynamics.
  • Optimized for Renko, Range Bar, and Intraday Trading.
  • Built for traders who need clarity and dynamic price zones.

This indicator is perfect for:

  • Mean reversion setups.
  • Identifying stretched moves for possible reversals.
  • Visual confirmation of breakouts beyond statistical boundaries.

No clutter. Just clean, responsive levels that move with the market.

0.0
Reviews: 0
Customer reviews
No reviews for this product yet. Already tried it? Be the first to tell others!
More from this author
JMA-Like
JMA-like is a highly responsive and ultra-smooth moving average designed to replicate the behavior of the original JMA!
You may also like
VWAP Tokyo Open
VWAP Set to Tokyo Open
Indicator
Grid
NAS100
NZDUSD
+19
Dynamic-Swing-Anchored-Vwap
“Dynamic Swing VWAP — Structure-Anchored, Volatility-Adaptive, Market-Ready.” 🚀
Zero Lag MACD
Zero Lag MACD delivers ultra-responsive trend and divergence signals with minimal lag, empowering timely Forex entries.
Indicator
Breakout
Round Number
Plots automatic psychological levels at round-number zones – major structure & liquidity levels.
Indicator
RSI
XAUUSD
ATR
+3
RSI NextGen
The RSI NextGen is an advanced and modernized version of the classic Relative Strength Index (RSI)
Indicator
Breakout
ATR
Signal
[Stellar Strategies] Market Structure Breakout
Flags breakouts of recent highs/lows on cTrader charts. Shows arrows/lines. Optional trend filter & sound alerts 📉📈
Indicatore livelli numeri tondi_fabio23.traders
Indicatore dei livelli numeri tondi sul grafico , regolabile.Indicator of levels round numbers on the graph, adjustable
Indicator
RSI
XAUUSD
Breakout
+5
Channel Price Predictor
🔮Channel Price Predictor: Anticipates future price zones with trend channels based on volatility and projections." 📈
Indicator
Breakout
ATR
LT_SmartSwings
Detects swing highs/lows, structure, breakouts, trend lines, and fibs — great for price action trading.
IVB 2.0
IVB 2.0 is an indicator that works on the strategy of imbalance of the maximum volatility box of indices
Indicator
EURUSD
Compare Symbol
Plots chosen symbol's close price, candlestick (wick, body) on cTrader chart, supports multiple timeframes.
Binary Options Signals Pro
Binary Options Signals Pro – Precision Trading at Your Fingertips
Indicator
NAS100
XAUUSD
Breakout
+10
VWAPSigmaBandPRO_Max
Professional VWAP + Sigma Bands. Auto signals, 3 modes, live stats, multi-level entry/exit. Proven volume-based system.
Indicator
Indices
Breakout
Prop
+4
Pivot Points Daily Session
Pivot Point with base zone daily Asia-London-New york Session.
Indicator
Indices
MFI-MTF
MFI- MTF is a multi-timeframe momentum indicator that brings higher timeframe perspective to your current chart
High TF Plotter
Captra High TF Plotter visualizes high timeframe Bar on lower timeframe charts, highlighting with bull/bear colors.
Indicator
Indices
RSI
Bollinger
Clustering
Clustering tool for traders with visual insights into market patterns.
Indicator
RSI
Breakout
XAUUSD
+5
Shielded Trend
Buy/Sell signals filtering noise, color-coded trends & strength shield 🛡️. Trade only with POWER ⚡