
Chandelier Exit
Indicator
5 purchases
Version 1.0, Oct 2025
Windows, Mac
4.3
Reviews: 3
Description
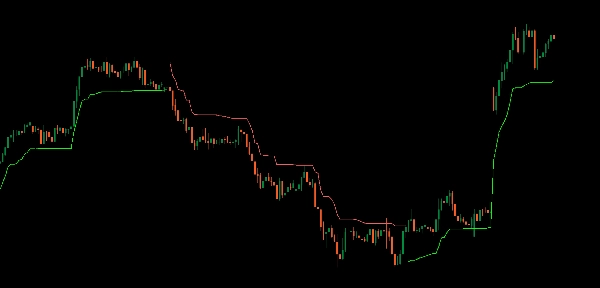
Introducing the Chandelier Exit indicator, your ultimate tool for optimizing trade exits with precision and confidence.
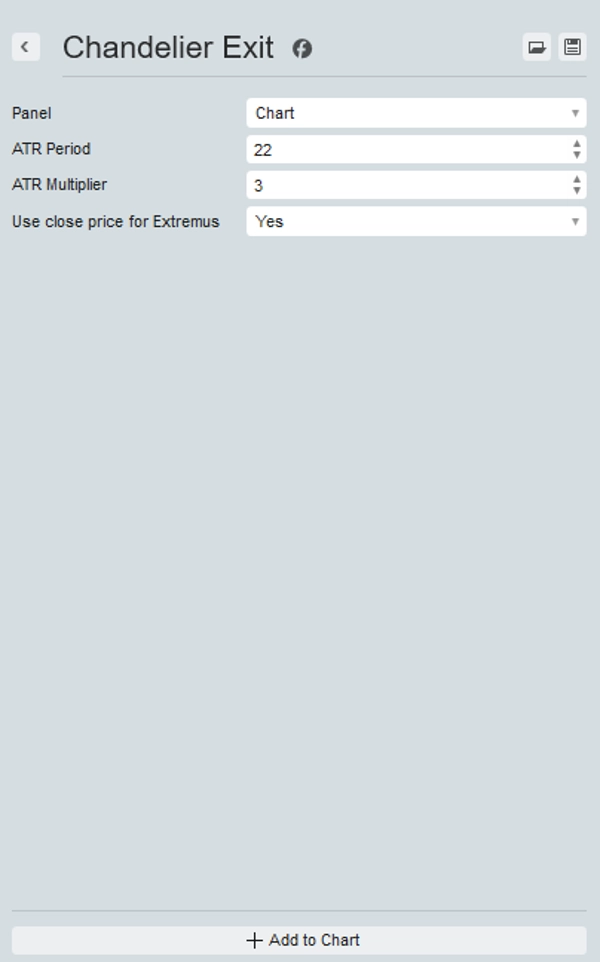
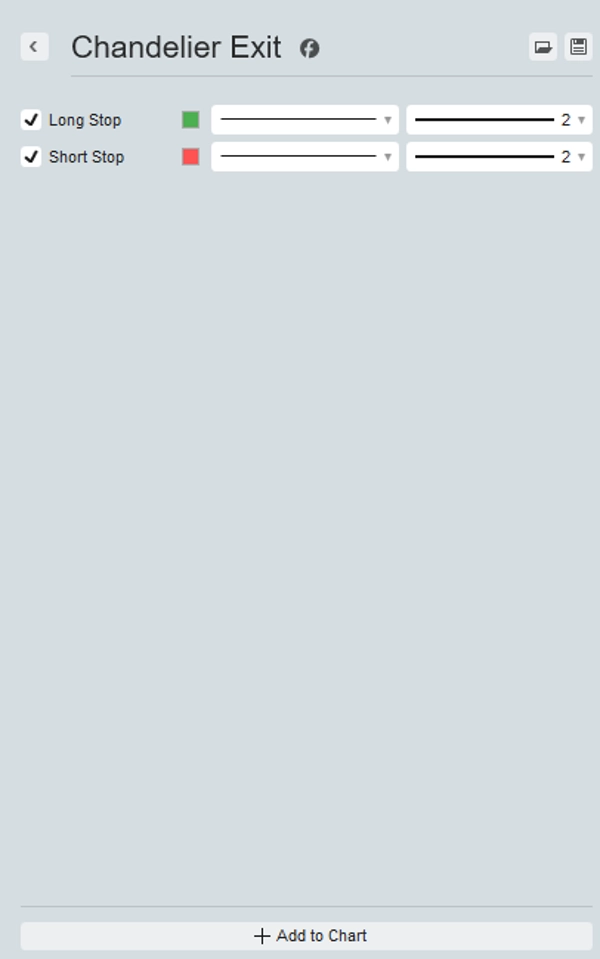
This indicator dynamically calculates stop-loss points based on the highest high and ATR, providing clear visual cues on your chart in real time.
Designed to help you lock in profits and protect against market reversals, the Chandelier Exit ensures you stay ahead of the curve.
Perfect for traders looking to enhance their strategy with reliable exit signals, this indicator offers a straightforward, visual approach to managing risk. Upgrade your trading toolkit and secure your gains with the Chandelier Exit.
Summary
AI summary
The Chandelier Exit indicator dynamically calculates stop-loss levels based on the highest high price and the Average True Range (ATR). It provides real-time visual cues on trading charts to help traders optimize exit points, lock in profits, and protect against market reversals. Suitable for various markets including Forex, cryptocurrencies, stocks, commodities, and indices, it supports symbols such as BTCUSD, EURUSD, GBPUSD, XAUUSD, NAS100, and USDJPY. The indicator offers a straightforward, visual method for managing risk and enhancing trading strategies by signaling reliable exit points.
Indicator profile
Customer reviews
4.3
Reviews: 3
5 | 33 % | |
4 | 67 % | |
3 | 0 % | |
2 | 0 % | |
1 | 0 % |
Customer reviews
October 9, 2025
Decent tool for testing if the trader wants it keeps trade control closer to the plan. It works best as support, not a final decision maker. The best use is 1 percent risk per trade, BE after 1R and partials near 1.5R. incorrect settings can give a false sense of safety.
October 8, 2025
October 8, 2025
Useful extra check for traders who care about risk before entries. It gives value around risk management, but incorrect settings can give a false sense of safety. I would check 30 trades and compare DD before and after the tool, aiming for less than 3 percent monthly DD. It is useful when the trader already respects stops and sizing.
Discussion
FAQ
BTCUSD
Forex
Signal
Indices
EURUSD
Commodities
GBPUSD
NZDUSD
Prop
Scalping
Crypto
Stocks
XAUUSD
NAS100
ATR
USDJPY
Products available through cTrader Store, including trading bots, indicators and plugins, are provided by third-party developers and made available for informational and technical access purposes only. cTrader Store is not a broker and does not provide investment advice, personal recommendations or any guarantee of future performance.


Price
Since 25/09/2025
25
Sales
315
Free installs