Brokers & props
For business
00
Days
:
00
Hours
:
00
Minutes
:
00
Seconds
Indicator
NAS100
NZDUSD
XAUUSD
Commodities
Forex
EURUSD
GBPUSD
BTCUSD
Indices
Prop
Stocks
Crypto
USDJPY
Moving Average PRO
07/11/2025
1
Desktop
Since 25/09/2025
Sales
12
"Moving Average PRO" uploaded image"Moving Average PRO" uploaded image"Moving Average PRO" uploaded image"Moving Average PRO" uploaded image

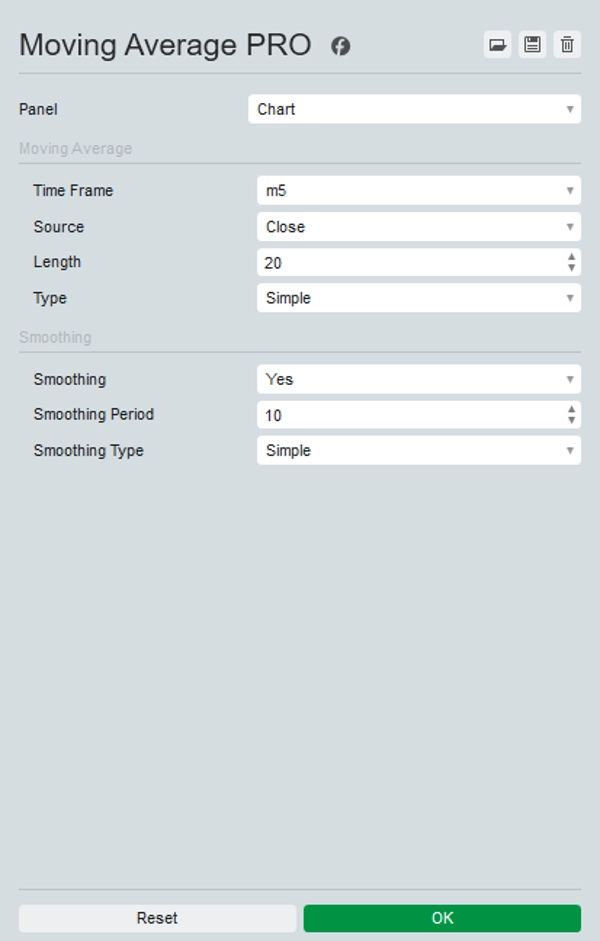
Introducing the enhanced Moving Average indicator, designed for better customization and flexibility in your trading analysis.

This enhanced version also support higher time frame moving averages to tick timeframes and Heikin Ashi. Renko and Range periods are not supported yet.

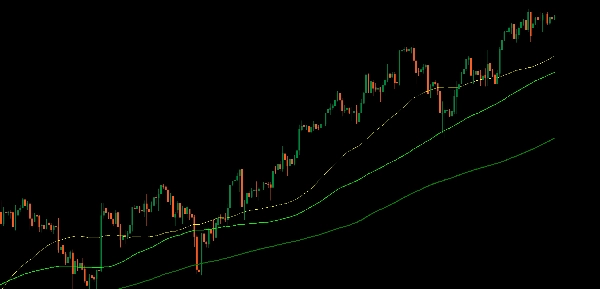
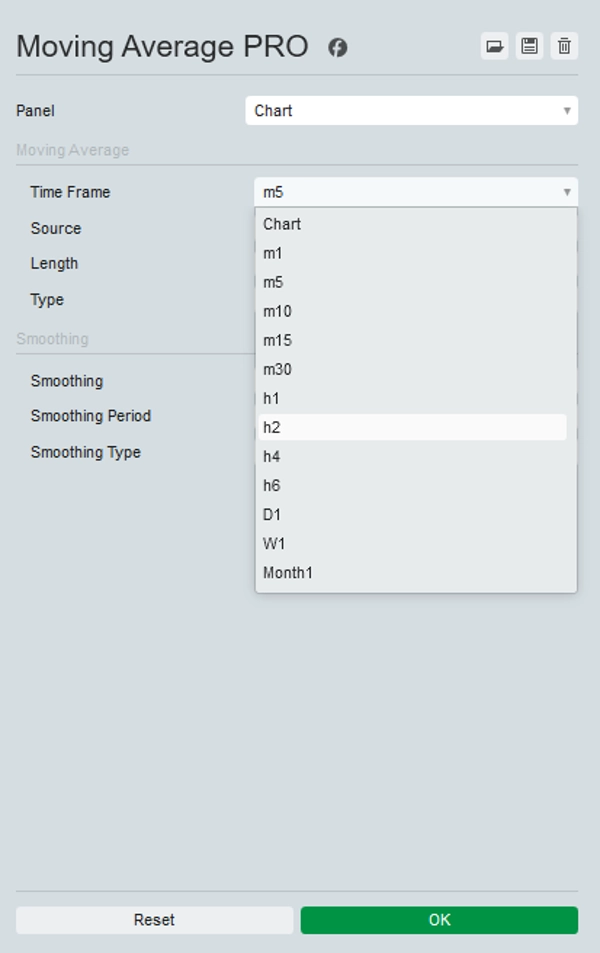
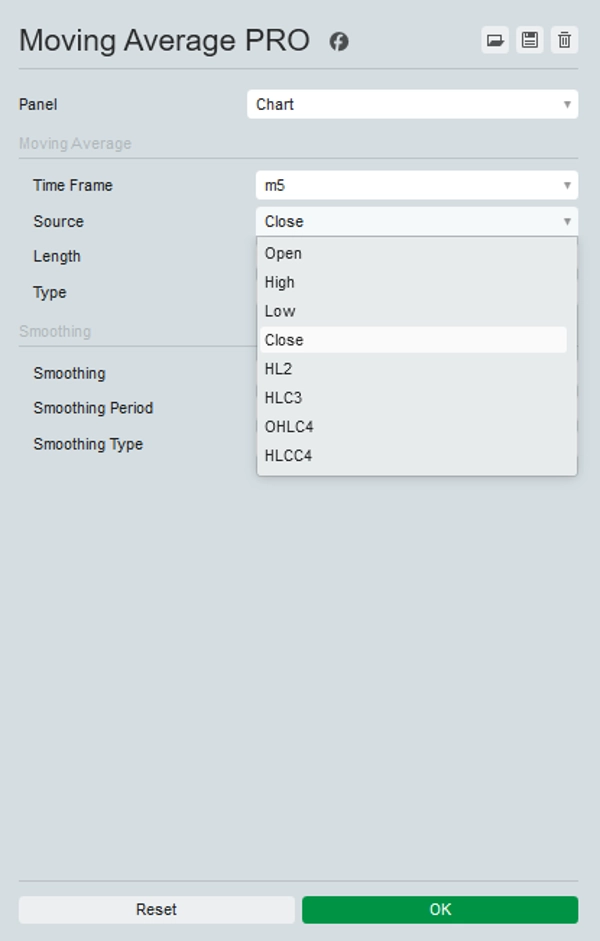
This indicator allows you to choose any timeframe enabling you to display, for example, the daily 200 MA on any other timeframe.

Additionally, it offers a range of price sources to select from, including Open, High, Low, Close, HL2, HLC3, OHLC4, and HLCC4, just like in TradingView and an optional smoothing options to address sampling issues on lower timeframes.

By providing these options, you can tailor the Moving Average to fit your specific trading strategy and gain more precise insights into market trends.

Upgrade your trading toolkit with the enhanced Moving Average indicator for superior analysis and decision-making.

0.0
Reviews: 0
Customer reviews
No reviews for this product yet. Already tried it? Be the first to tell others!
More from this author
Indicator
NAS100
NZDUSD
XAUUSD
+13
Chandelier Exit
Optimize exits with Chandelier Exit! Visualize stop-loss points dynamically for improved trading precision and safety.
Indicator
NAS100
NZDUSD
Breakout
+12
ATR Bands
Enhance trading with ATR Bands! Visualize market volatility using dynamic upper and lower ATR bands for precise decision
Indicator
NAS100
NZDUSD
XAUUSD
+13
MACD Crossover PRO
Customize the MACD! Choose colors, get real-time tick updates, and see crossover points for enhanced trading precision.
Indicator
NAS100
NZDUSD
XAUUSD
+13
MACD Histogram PRO
Enhance MACD Histogram! Visualize bull and bear price changes with vibrant colors for clearer, more insightful trading.
Indicator
NAS100
NZDUSD
XAUUSD
+12
QQE Qualitative Quantity Estimation
Unlock trading precision with QQE! Dual QQE indicators with a Bollinger Bands zero line provide clear buy/sell signals.
Indicator
NAS100
RSI
NZDUSD
+13
Stochastic RSI PRO
Unlock Stochastic RSI PRO in cTrader! Overlay RSI, highlight zones, and identify divergences with customizable settings.
Indicator
NAS100
NZDUSD
XAUUSD
+11
Consolidation Zones
Identify and trade breakouts with Consolidation Zones! Visualize price consolidation areas for trading opportunities.
Indicator
Grid
NAS100
NZDUSD
+13
Standard Deviation Channel
Visualize trends with Standard Deviation Channel! Display median, and add customizable upper/lower deviation channels.
Indicator
NAS100
NZDUSD
Breakout
+14
Bollinger Bands Cloud
Visualize Bollinger Bands with a colored cloud for clarity. Enhance your trading precision with this dynamic indicator!
Indicator
NAS100
NZDUSD
XAUUSD
+11
TradingView ATR
Upgrade to ATR-RMA! Experience the precise ATR using Relative Moving Average for accurate volatility analysis in cTrader
Indicator
NAS100
NZDUSD
XAUUSD
+11
TSI True Strength Index
Enhance trading with TSI! Use the True Strength Index for clear insights into market momentum and trend strength.
Indicator
NAS100
NZDUSD
Breakout
+13
VWAP Volume Weighted Average Price
Unlock VWAP in cTrader! Choose anchor periods, price sources, and display deviation bands with real-time tick updates.
You may also like
Indicator
NAS100
NZDUSD
RSI
+13
Multi Timeframe Trend Scanner
Multi Timeframe Trend Scanner 🔍 EMA+RSI+ATR heatmap with clear BUY/SELL bias from M5 up to D1.
Indicator
NAS100
Indices
XAUUSD
+7
InstitutionalSignalOscillator
A precision-engineered indicator designed for traders who demand signal integrity across volatile markets.
Indicator
Indices
Prop
Breakout
+4
Higher TimeFrame Candle Tracker
Higher TimeFrame Candle Tracker: Current Timeframe (Any TimeFrame) Show High TimeFrame Candle Bar
Indicator
EURUSD
Compare Symbol
Plots chosen symbol's close price, candlestick (wick, body) on cTrader chart, supports multiple timeframes.
Indicator
Indices
RSI
Stocks
+5
REDGREENZONEREVERSAL
The Red & Green Zone Reversal Indicator detects overbought and oversold market conditions using Bollinger Bands and RSI.
Indicator
NAS100
NZDUSD
Forex
+23
DailyMA
Daily moving averages, simplified. Displays 3 daily moving averages on lower timeframes with selectable MA types.
Indicator
Indices
Prop
Stocks
+3
Dynamic Candle Timer v1.5 2025
Dynamic Candle Timer is a fully customizable feature-packed indicator that offers multiple count-down/up modes and...
Indicator
NAS100
NZDUSD
Martingale
+26
Smart Money Gaps
Smart Money Gaps: MTF FVG auto-detection, extension, and mitigation marker. Trade institutional imbalances.
Indicator
Indices
E7 BlackScholes Model
Option pricing using the BlackScholes model and the Math.Numerics packages
Indicator
Indices
Forex
Crypto
Super Arrows
Super Arrows
Indicator
NAS100
NZDUSD
Breakout
+12
rolling stdv
Multi-Timeframe Rolling Volatility Indicator - Smart Volatility Breakout System
Indicator
Stocks
Forex
Crypto
Trend Angle Indicator [Iridio Capital]
The Trend Angle Indicator provides a clear and intuitive way to visualize market trends.
Indicator
RSI
Forex
Signal
+2
Rsi_custom
🔹 Advanced RSI with smart alerts and visual signals for faster trend reversal detection.
Indicator
Signal
USDJPY
On Balance Volume USD - Combined
See USD demand in one line—Composite OBV fuses six major FX pairs into a clear momentum gauge.
Previous Day Equilibrium (Premium & Discount)
Plots the equilibrium price levels based on previous daily highs and lows.
Indicator
RSI
MACD
SmartBot-MACD & RSI Indicator
This indicator is a combination of MACD and RSI into one. This is perfect fusion and powerful indicator ever.
Bollinger Bands Breakout Oscillator (+ Alerts)
BB Breakout Oscillator with alerts! Spot trend reversals using Bollinger Bands. Bullish/Bearish crossovers Alerts.
Market Entropy
Market entropy + DC. Spot crystallization/chaos shifts with an optional on-chart overlay.