"Standard Deviation Channel" logo
Standard Deviation Channel
"Standard Deviation Channel" uploaded image
Since 25/09/2025
21
Sales
181
Free installs

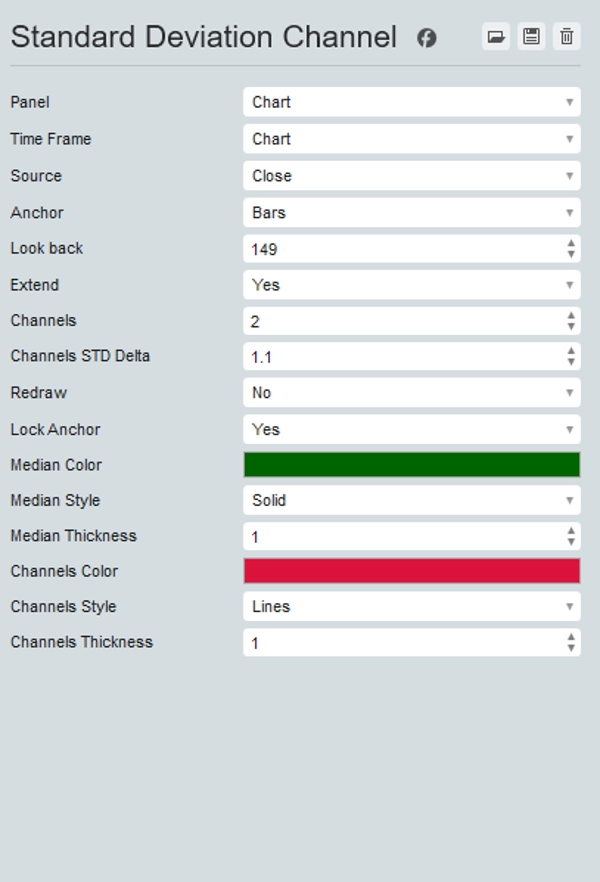
Introducing the Standard Deviation Channel indicator for cTrader, a powerful tool designed to help you visualize market trends with precision.

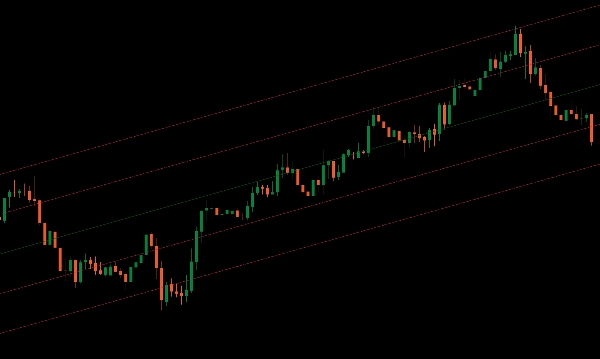
This indicator displays the median of a specified period on your chart, providing a central reference point for price movements.

Additionally, it allows you to add a desired number of upper and lower channels at multiples of the standard deviation, giving you a clear view of price volatility and potential breakout zones.

Perfect for traders seeking enhanced analytical capabilities, the Standard Deviation Channel indicator helps you identify trend directions and potential reversal points with ease.

Upgrade your trading toolkit with the Standard Deviation Channel for superior market analysis and decision-making.

Indicator profile
0.0
Reviews: 0
Customer reviews
No reviews for this product yet. Already tried it? Be the first to tell others!
BTCUSD
Forex
Breakout
Indices
EURUSD
Commodities
GBPUSD
NZDUSD
Prop
Scalping
Crypto
Grid
Stocks
XAUUSD
NAS100
USDJPY
Products available through cTrader Store, including trading bots, indicators and plugins, are provided by third-party developers and made available for informational and technical access purposes only. cTrader Store is not a broker and does not provide investment advice, personal recommendations or any guarantee of future performance.

More from this author

Professional execution engine for the Visual Risk Terminal. Instant batch orders, PnL syncing, and automated hedging.
1
Profit factor
0%
Max drawdown
Optimize exits with Chandelier Exit! Visualize stop-loss points dynamically for improved trading precision and safety.
Enhance trading with ATR Bands! Visualize market volatility using dynamic upper and lower ATR bands for precise decision
Enhance MACD Histogram! Visualize bull and bear price changes with vibrant colors for clearer, more insightful trading.
Unlock trading precision with QQE! Dual QQE indicators with a Bollinger Bands zero line provide clear buy/sell signals.
Customize the MACD! Choose colors, get real-time tick updates, and see crossover points for enhanced trading precision.
Identify and trade breakouts with Consolidation Zones! Visualize price consolidation areas for trading opportunities.
Unlock Stochastic RSI PRO in cTrader! Overlay RSI, highlight zones, and identify divergences with customizable settings.
Visual risk management terminal for cTrader. Set Lot size, SL, and TP via chart lines with real-time PnL projections.
Customize your Moving Average! Choose any timeframe and price source for precision and flexibility in your analysis.
Advanced MACD & Supertrend bot. Professional trend-following logic with ATR risk management and active profit-taking.
18%
1.82
Profit factor
20.05%
Max drawdown
Visualize Bollinger Bands with a colored cloud for clarity. Enhance your trading precision with this dynamic indicator!

You may also like

Liquidity Pressure Index is a tool that gives traders deeper insights into the hidden dynamics of market liquidity
SUPER TREND Oscillatore
Momentum-adaptive MA: scales responsiveness via deviation — fast in trend, smooth in chop.
Market Profile TPO for cTrader — full auction logic, IB, POC, VA zones, histogram and O/X markers with time
SSL Channel: Tracks trends 📈 measures volatility ⚡filters noise via ATR+SSL. Clear signals for precise entries/exit...
Multi-Timeframe Rolling Volatility Indicator - Smart Volatility Breakout System
Noise-filtered Supertrend, swing strength scoring, and S/R zones with polarity tracking. Structure over signals.
technical analysis tool designed to provide traders with a structured view of market momentum and volatility
Our Advanced MACD Indicator is not just a simple histogram. This indicator is designed to provide a clear and dynamic...
📊 Shows volume by price levels, highlights POC, and key zones. Identifies dynamic support/resistance and imbalances.
Customizable window inside your platform, access to any website Calendar Was Free for early users now -50%
IR Candle Open plots customizable opening price lines for daily, weekly, and monthly candles
Performance Panel von BullMoon Finance: Analysiere Deine cTrader-Historie visuell direkt im Chart!
Draw Fibonacci on the current day, previous day, current week, and previous week on all charts.
Indicator that calculates the slope of a moving average (SMA) and displays the value of the slope in degrees
Automatically plots Daily and Weekly Fibonacci retracements with smart redraw and session control.
MACD Indicator with Histogram that plots Colors Based on Direction Above and Below the Zero Line.
Plots automatic psychological levels at round-number zones – major structure & liquidity levels.
Since 25/09/2025
21
Sales
181
Free installs