
Description
TREND ANALYSIS is an advanced technical indicator for the cTrader platform that combines multiple analytical approaches into a single solution. Developed for traders seeking trend confirmation through indicator convergence, it offers a complete market view with precise signals and validation filters.
WATCH THE INTRODUCTORY VIDEO ON OPERATIONAL STRATEGY!
🎯 USAGE STRATEGIES
1. Trend Following Trading
Application: Identify and follow established trends
Timeframe: H4, D1 for longer positions
Settings: ADX > 25, Volume above average
Risk Management: Stop-loss below the 50-period moving average
2. Swing Trading
Application: Capture medium-term movements
Timeframe: H1, H4
Settings: Volume filter enabled, confirmation by Volume Profile
Targets: Volume Profile POC as TP
3. Breakout Trading
Application: Enter on support/resistance breakouts
Settings: PVA volume to confirm the strength of the movement
Confirmation: ADX rising + Volume above average
4. Scalping (Shorter Timeframes)
Application: Quick trades with multiple confirmations
Timeframe: M1, M5
Settings: Strict volume filters and Momentum
🔧 HOW THE INDICATORS WORK
CORE ADX & DI
ADX (Average Directional Index)
Function: Measure trend strength
Interpretation:
0-25: Weak trend/sideways movement
25-50: Strong trend
50+: Very strong trend
Practical Use: Avoid trades when ADX < 20
+DI / -DI (Directional Indicators)
+DI: Buyer strength
-DI: Seller strength
Signal: Crossover of +DI above -DI (buy) and vice versam
ADX Slope (ADX Slope)
Function: Measure trend acceleration
Plotting: Cyan histogram
Signal: Positive values indicate a strengthening trend
VOLUME FILTERS
Volume MA Filter
Function: Validate signals with above-average volume
Parameters: Period 20, Multiplier 1.0
Use: Confirmation of institutional interest
Volume PVA (Price Volume Analysis)
Colors and Meaning:
Green: Buy with very high volume (>150% average)
Blue: Buy with high volume
Red: Sell with very high volume
Pink: Sell with high volume
Yellow: Pin Bar/Exhaustion with support break
VOLUME PROFILE
POC (Point of Control)
Function: Price with the highest traded volume
Use: Natural target for trades, dynamic support/resistance
Value Area
Function: Zone where 70% of the volume was traded
Interpretation:
Price above: Uptrend
Price Welow: Downtrend
Inside: Possible sideways movement
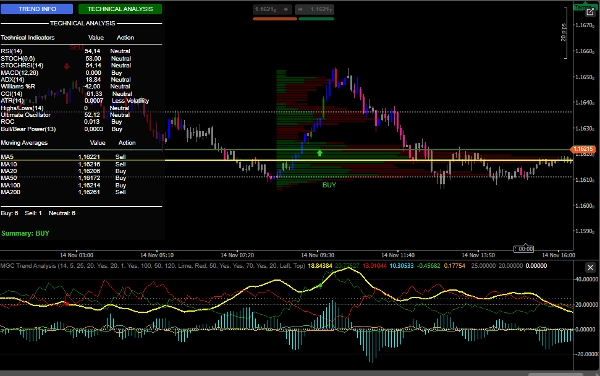
COMPLETE TECHNICAL ANALYSIS
Indicator Panel
RSI: Oversold (<30) / Overbought (>70)
MACD: Momentum
Williams %R: Extreme Conditions
CCI: Reversal Identification
Stochastic: Short-term Momentum
Ultimate Oscillator: Multi-timeframe Momentum
Moving Averages
Full set of MAs (5, 10, 20, 50, 100, 200)
Alignment analysis for trend
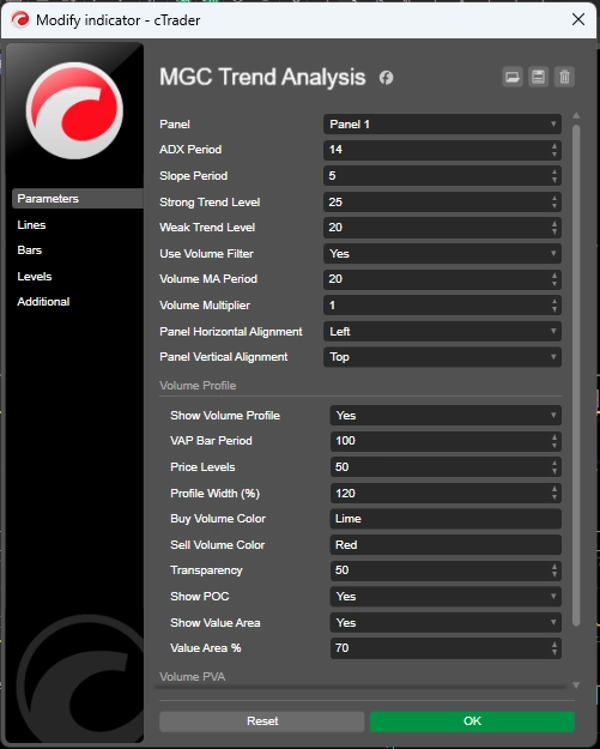
⚙️ RECOMMENDED SETTINGS
Conservative Setting
javascript
ADX Period: 14
Slope Period: 5
Strong Trend Level: 25
Weak Trend Level: 20
Use Volume Filter: true
Volume MA Period: 20
Volume Multiplier: 1.2
Aggressive Setting
javascript
ADX Period: 10
Slope Period: 3
Strong Trend Level: 20
Weak Trend Level: 15
Use Volume Filter: true
Volume MA Period: 14
Volume Multiplier: 1.0
Volume Profile (Recommended)
javascript
Show Volume Profile: true
VAP Bar Period: 100
Price Levels: 50
Value Area %: 70
Show POC: true
🎨 VISUAL RESOURCES
User Interface
Dynamic Panel: Real-time information
Interactive Buttons: Switch between analyses
Intuitive Colors: Function-based coding
Graphical Signals
Arrows: BUY/SELL entries
Sounds: Audible alerts
Bar Colors: Integrated PVA analysis
Summary
Customer reviews
5 | 67 % | |
4 | 33 % | |
3 | 0 % | |
2 | 0 % | |
1 | 0 % |


