"Blocks Liquidity MGC" logo
Blocks Liquidity MGC
0.0
06/08/2025
29
Desktop

This indicator identifies liquidity zones and order blocks in the market, following concepts from Smart Money Market Theory (ICT/SMC).

https://ctrader.com/pt/products/1560

https://ctrader.com/pt/products/1386

The indicator operates in four main steps:

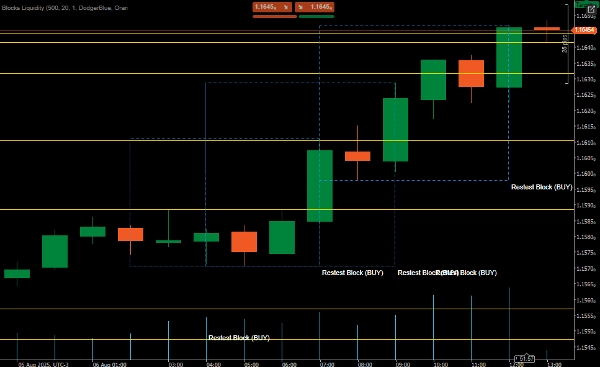
✅Order Block Identification

Detects impulsive movements (minimum 20 pips by default)

Finds consolidation zones before impulse

Classifies as a buy or sell block

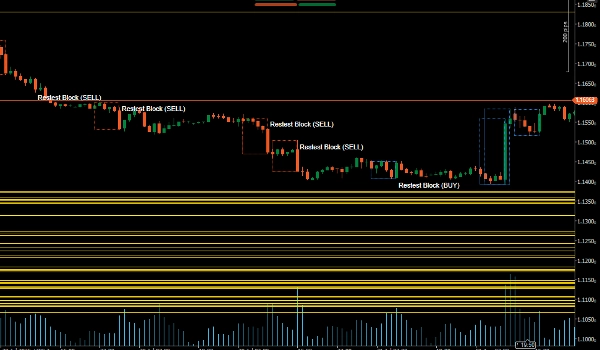
✅Liquidity Pool Identification

Marks recent highs and lows as liquidity zones

These areas represent potential targets or stopping points

✅Retest Confirmation

Checks when the price returns to order blocks

Confirms with reversal patterns (Pin Bar/Engulfing) and volume

✅Chart Visualization

Draws order blocks and liquidity zones

Emits audible alerts upon confirmation


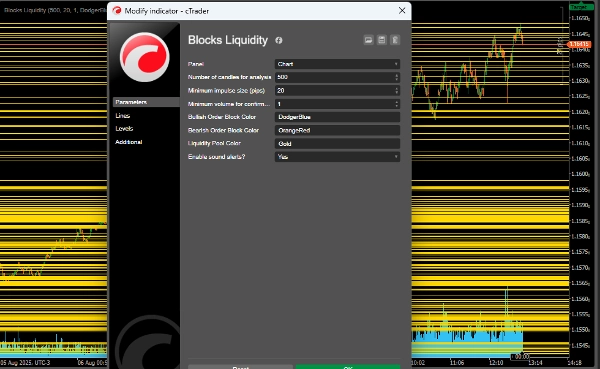
✅Configurable Parameters

LookbackPeriod: Number of candles to analyze (500 by default)

MinImpulsePips: Minimum size of the impulsive movement (20 pips)

MinVolumeThreshold: Minimum volume for confirmation (1.0)

Customizable colors for bullish/bearish blocks and liquidity zones

Sound alert option


✅Trading Logic

Bullish (buy) blocks:

Formed after consolidation and upward momentum

Potential support zone

Entry confirmed by reversal pattern + volume on retest

Bearish (sell) blocks:

Formed after consolidation and downward momentum

Potential resistance zone

Entry confirmed in the same way


✅Liquidity Pools:

Recent highs/lows as targets or stops

Areas where there is likely concentration of stop orders


More from this author
Block Order Rreversal
Order BlockIndicator reversal
cBot
breakout
indices
rsi
+1
CHART PATTERN BOT
Chart Patterns Algo Bot
PVA Volume+Analysis_noSourceCode
PVA Volume Analysis Indicator:Price volume over trend strength and direction
cBot
ai
eurusd
Resolver Algo Bot
Resolver Algo Bot,Sophisticated, Perfect algorithm EurUsd! Daily ROI 5 to 24%.
Indicator
signal
Master Dragom SR
Indicator,combines with several strategies.MA locate trends,pullback, signal volumes, reversals, support and resistance
cBot
breakout
forex
ai
+6
Resolver Range PRO
Resolver PRO A.I Bot,Sophisticated, Perfect algorithm! Daily ROI 5 to 24%.Maximum drawdown 4%
Indicator
forex
eurusd
EconomicForex
ECONOMIC FOREX:provides insights into inflation, nominal interest rates and real interest rates, in the line chart
cBot
forex
ai
eurusd
+1
GRADIENTE LINEAR FOREX_noSourceCode
Sophisticated GRADIENTE algorithm , performance 11% per day drawdown 4%
MAGIC BLOCK STRATEGY
Block Liquidity,indicator.Block Order, Liquids Stops, Signal Sentiment,signal correctio.[
Nexus Prime Bot
Versatile Adaptive System, for Scalper, Long trader, HFT
Pattern Signal Forex
Indicator pattern signal moment
BLOCK LIQUIDITY PRO
Block Liquidity,indicator.Block Order, Liquids Stops, Signal Sentiment,signal correctio.
cBot
forex
commodities
stocks
Resolver Range Pro 2.3
Resolver PRO 2.3 Bot,Sophisticated, Perfect algorithm! Daily ROI 5 to 24%.Maximum drawdown 4%.
cBot
forex
stocks
Quark Forex Paid 1
Quark automatic system Three Strategies
cBot
forex
ai
eurusd
+3
NEBULA EDGE IA
Adaptive decision-making AI ROBOT that evolves with the market, dynamic risk management and ML optimization.
cBot
forex
stocks
Linear Gradiente v3
GRADIENTE LINEAR algorithm , performance 11% per day drawdown 4%
Indicator
signal
DARK POLL SIGNAL_noSourceCode
Dark Poll Signal Indicator.liquidity leakage,precedes the great movement, accumulation, distribution
You may also like
DMG Indicator POSIZIONE APERTE e Prezzi ,SU GRAFICO
Visualizzazione delle Posizioni dei simboli attivi su grafico
Indicator
forex
indices
prop
+5
New Way Sar - Pro
The Parabolic SAR, or "Stop and Reverse," is a dynamic technical analysis tool
Indicator
bollinger
Repiptor BB Width
Bollinger Bands Width
calculateSpreads_withSourceCode
Indicator calculates spread in pips
Indicator
breakout
indices
vwap
+4
ProVWAP
Advanced Anchored VWAP for cTrader: volatility bands, real‑time alerts & customizable session resets.
Indicator
signal
scalping
[Stellar Strategies] Linear Regression Candles 1.1
Approach to price analysis by visualizing candlestick data through the lens of linear regression slopes 📈📉
Indicator
bollinger
E7 Indicators Free Studies
ADXR, KDJ, SineWave, Bollinger Band Volatility and AEOscillator.
DailyPivotPoints
Daily Pivot Points plots key support and resistance levels to guide precise trading decisions.
Renko Moving Average Cross Indicator
The Renko Moving Average Cross indicator combines classic EMA crossover signals with Renko-filtered prices.
Indicator
forex
commodities
scalping
+1
Support & Resistance Pro
The Support & Resistance Pro helps traders identify key support and resistance levels for informed trading decisions.
Indicator
breakout
AutoLines™ Support & Resistance
FlexSR auto‑detects pivot highs/lows to plot dynamic support & resistance lines Features customizable styling and option
ICT Killzones & Macros
KILLZONES AND MACRO SESSIONS
MA Sabres
Conquer the markets with MA Sabres! This indicator spots trend flips with MAs and cool Sabre shapes & alerts.
Repiptor Candlescope Lite
Candlestick pattern detector lite version
Hull Moving Average Colored
The traditional Hull Moving Average with different colours based on the slope (direction) of the trend.
Indicator
forex
eurusd
usdjpy
4 Currencies V2_NSC
Relative Currency Strength 4 Currencies: AUD USD EUR JPY
Daily Weekly Monthly - Highs & Lows
Daily/Weekly/Monthly - Highs & Lows Indicator (Customizable Settings)
Indicator
forex
indices
prop
+3
Fractals
Fractals is a precision-engineered trading indicator for cTrader that reveals the hidden architecture of price action.