Indicator
Signal
Hammer Pattern Indicator
"Hammer Pattern Indicator" logo
5.0
03/09/2025
135
Desktop
Since 21/02/2025
Traded volume
449.9M
Pips won
173.3K
Sales
3
Free installs
2722
"Hammer Pattern Indicator" uploaded image"Hammer Pattern Indicator" uploaded image

Hammer Pattern Indicator – Strategy Explanation

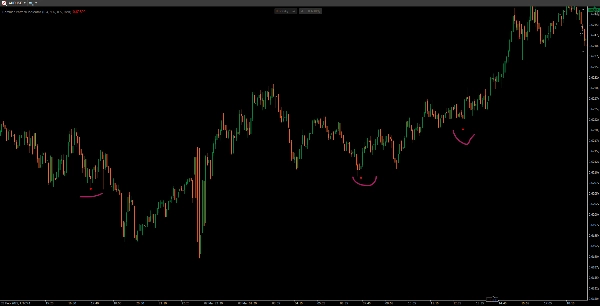
This Hammer Pattern Indicator is a candlestick-based reversal signal that identifies bullish hammer patterns in a downtrend. It is designed to detect potential trend reversals and highlight buying opportunities.


How It Works

1️⃣ Detects Downtrend

  • The candle’s closing price must be lower than the close 3 bars ago, indicating a potential downtrend.

2️⃣ Validates Hammer Candlestick Structure

  • Small Body: The body of the candle is relatively small (≤ 30% of total range).
  • Long Lower Shadow: The lower wick is at least 2 times the body size (shows strong rejection of lower prices).
  • Short Upper Shadow: The upper wick is ≤ 30% of the body size (indicating little resistance at the top).

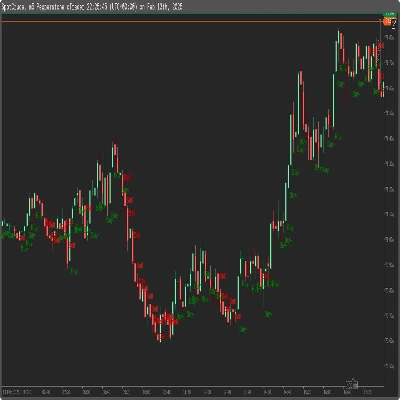
3️⃣ Plots a Buy Signal

  • If all conditions are met, a red dot (or a chosen color) appears slightly below the low of the hammer candle as a visual confirmation of a potential reversal.


Key Features

Filters weak signals by ensuring a prior downtrend.
Customizable parameters for body size, shadow length, and colors.
Simple yet effective candlestick pattern for swing traders and price action traders.

📌 Best Use: Confirm the hammer pattern with additional indicators (e.g., volume, support levels) for stronger signals! 🚀

More from this author
Indicator
RSI
Indices
Forex
+3
ScalpingSignals9000
High-probability trading signals in the fast-paced world of forex and CFD trading.
Indicator
Indices
Prop
ATR
+4
TrendPulse
BrickAlgo TrendPulse is an advanced technical analysis tool that combines multiple indicators with filterin mechanisms.
Indicator
RSI
Indices
Signal
Rsi + Volume
This indicator combines RSI (Relative Strength Index) with volume analysis to generate more reliable trading signals.
SmartArrows AI V2
High-Performance Renko Chart Indicator with Advanced AI Filtering.
Indicator
Signal
Scalping
9-5-3 Trading Strat
Enhance Your Trading Strategy with the Larry Williams 9-5-3 Indicator
Indicator
Stocks
Forex
Signal
+1
Engulfing Pattern Indicator
EURUSD Breakout Indicator
Breakout Multi-Timeframe Strategy Indicator
Indicator
Stocks
Forex
Crypto
PinBarCandlestickPattern
PinBarCandlestickPattern Indicator
Indicator
RSI
Signal
MA-RSI HTF Confirmation
MA-RSI HTF Confirmation: Eliminate false signals and trade with confidence!
Indicator
Prop
Commodities
Stocks
+2
Light-Version BrickAlgo TrendPulse
🚀 Simplify Your Trading Decisions With Powerful Technical Analysis.
Indicator
Signal
MACD
USDJPY
PulseTracker
Version 1.2: Advanced Trend Detection & Visualization System
Renko Moving Average Cross Indicator
The Renko Moving Average Cross indicator combines classic EMA crossover signals with Renko-filtered prices.
cBot
Forex
Signal
MACD
SwingStratH6
Smart Trend cBot - Swing6h
Indicator
Forex
Signal
MACD
swingh6
Swing-Trading Indicaotr for pairs like EUR/USD, AUD/USD, and USD/JPY. Most effective on higher time frames H4,H6,H12...
ADX and ADI
This custom indicator is a complete implementation of the Average Directional Index and Directional Indicators.
You may also like
Indicator
RSI
Breakout
XAUUSD
+5
Dynamic Range MomentumI
This histogram helps visualize the strength and direction of market movements, making it easier to spot potential trends
MMXM Structure by Ludwig
MMXM Structure by LudwigICT – Professional Market Structure Mapping Tool
Side Volume Profile
Right-anchored cTrader Volume Profile with VAH/VAL/POC, LVZ, top volume+EMA, themes, and fast, readable visuals.
Indicator
Commodities
Forex
Compra e Venda
Indicador Compra e Venda é um rastreador de tendência.
Indicator
RSI
Breakout
XAUUSD
+13
Fear & Greed Index
Fear & Greed Index: 4 configurable components (momentum, volatility, strength, pattern) with 6 calculation methods each
Indicator
NAS100
NZDUSD
Martingale
+22
Zigzag Trend
The ZigZag Trend is a market structure tool that filters out small price fluctuations and highlights major swing.
SessionPowerZonesPro
Highlights market sessions & overlaps with real-time range & volume stats – perfect for pro scalpers.
smma tel
Wstęgi HTS 33 144 mobile
IR Multi Data
show symbol and time fram, daily net profit percent, daily net profit, and spread ln your chart. consider that timezone
Indicator
ZigZag
RSI
FVG
+4
Ten Thousand Functions Bands Cloud(First Edition)
A metric that can set 1 to 3 groups of Bollinger Bands
LT_FairValueGap
Detects valid Fair Value Gaps from strong 3-bar patterns. Keep drawing unfilled gaps until price fills them.
Indicator
NAS100
NZDUSD
XAUUSD
+12
Volume Meter
Volume Meter
Zero Lag Exponential Moving Average
ZLEMA (Zero Lag EMA) is a faster, smoother version of EMA, ideal for capturing quick market shifts and trends.
IR CheckList
you could put your check list in your chart you could split your test with “,” you could put your checklist in indicat
True Trend H4
It draws a step line that visualize the movement of H4. Particularly effective when trade on lower timeframe.
PVA Volume+Analysis_noSourceCode
PVA Volume Analysis Indicator:Price volume over trend strength and direction
Indicatore utbot
L'indicatore UTBot è uno strumento di analisi tecnica che crea una linea di trailing stop dinamica basata sull'ATRT
Indicator
RSI
XAUUSD
Breakout
+5
BOS & CHOCH
Market structural patterns , specifically the concepts of Change of Character (ChoCH) 🔄 and Break of Structure (BoS) 💥