Description
Quarterly Theory Indicator (ICT) — Session Zones & Smart Signals
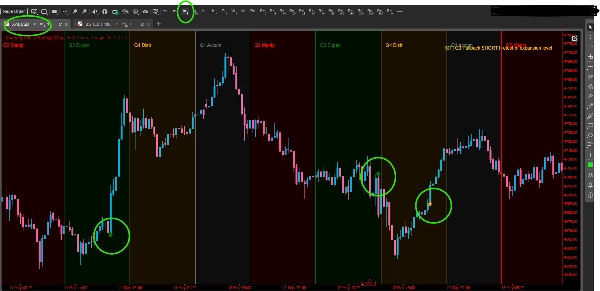
The Quarterly Theory Indicator brings the ICT (Inner Circle Trader) session cycle framework directly onto your cTrader chart. Based on the concept that each 24-hour trading day is divided into four distinct 6-hour phases, the indicator automatically identifies and visualizes:
- Q1 – Accumulation (18:00–00:00 NY): Smart money positions quietly
- Q2 – Manipulation (00:00–06:00 NY): False moves & stop hunts
- Q3 – Expansion (06:00–12:00 NY): The real directional move
- Q4 – Distribution (12:00–18:00 NY): Profit-taking & reversals
Key Features
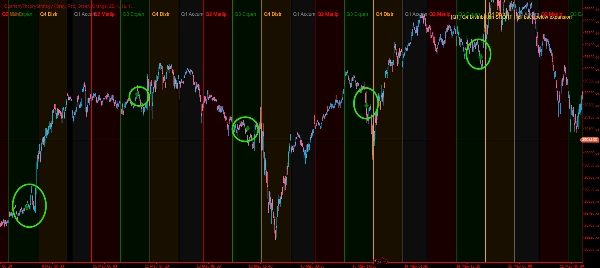
Session Zone Backgrounds Each quarter is shaded with a fully customizable color background and labeled directly on the chart. Colors, opacity, and border thickness are all adjustable. Zones update dynamically on scroll and zoom.
4 Smart Entry Signals
- Q2 Stop-Hunt — detects sweeps of Q1 highs/lows that close back inside, signaling a trap reversal
- Q3 Expansion Entry — fires when price breaks out of the Q2 range, marking the true directional move
- Q3 Pullback Entry — identifies retests of the expansion breakout level for lower-risk entrie
- Q4 Distribution — alerts when price crosses back through the expansion level during the distribution phase
Each signal is drawn as a directional arrow (↑↓) directly on the chart bar where the condition is met.
Built-in Alerts When running on a live bar, the indicator plays a sound and displays an on-screen message for any fired signal — no manual watching required.
Performance Control A configurable Days to Show parameter (1–60 days) limits how far back zones and signals are drawn, keeping RAM usage low even on high-frequency timeframes.
NY Session Alignment Supports both EST (UTC−5) and EDT (UTC−4) offsets, ensuring accurate zone boundaries regardless of your broker's server time.
Summary
The indicator provides four smart entry signals directly on the chart as directional arrows: Q2 Stop-Hunt (detects false breakouts within Q1 highs/lows), Q3 Expansion Entry (signals breakout from Q2 range), Q3 Pullback Entry (identifies retests of breakout levels), and Q4 Distribution (alerts on price crossing back through expansion levels). These signals include real-time alerts with sound and on-screen messages when conditions occur on live bars.
Additional features include a configurable "Days to Show" parameter to limit historical data display for performance optimization and support for both EST and EDT time offsets to align session zones accurately with New York time. The indicator is tagged with market structure concepts such as Fair Value Gap, Break of Structure, and Liquidity Sweep, and outputs visualizations, signals, and filters based on bar data.
Customer reviews
5 | 0 % | |
4 | 100 % | |
3 | 0 % | |
2 | 0 % | |
1 | 0 % |