"Woodie_CCI_pro" logo
Woodie_CCI_pro
"Woodie_CCI_pro" uploaded image
Since 24/10/2025
1.08M
Traded volume
3.12K
Pips won
2
Sales
238
Free installs

Woodie_CCI_pro is an advanced CCI-based toolkit built around the classic Woodie CCI methodology.
It plots a Woodie-style CCI with smoothing and highlights the most important Woodie patterns with clear on-chart signals, optional oscillator markers, and optional TLB trendline guidance inside the CCI pane for better context and faster decision-making.

Designed for clean historical visibility: all signals are drawn on history, labels show the exact pattern name, and trendline rendering is optimized to avoid scale distortion and “line artifacts”.


Core Features

1) Woodie Pattern Detection (Auto Signals)

Woodie_CCI_pro detects and labels the following Woodie patterns:

  • ZLR (Zero Line Reject)
  • Ghost
  • HFE (Hook From Extreme)
  • TLB (Trend Line Break)
  • HTLB (Horizontal Trend Line Break)
  • RD (Reverse Divergence)
  • Famir
  • Vegas Trade (VT)

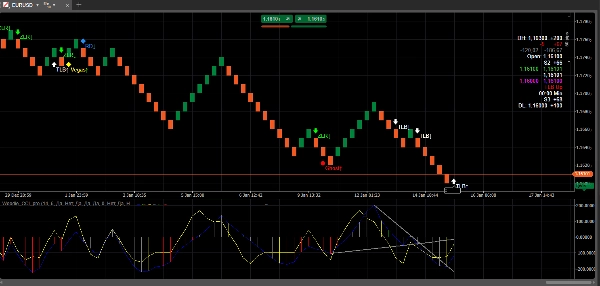
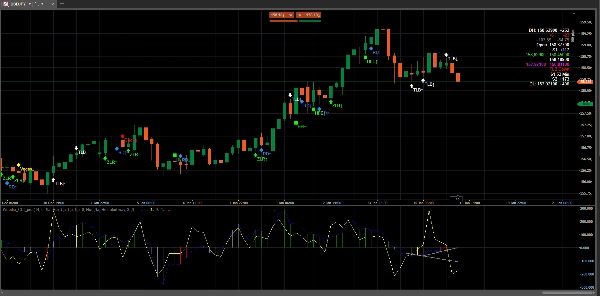
Each signal is drawn with direction-aware markers (Up/Down) and a label (e.g., ZLR↑, TLB↓) so you always know exactly what fired.

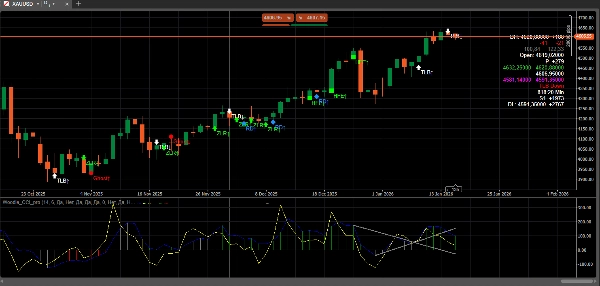
2) Signals Directly on the Price Chart

Signals are displayed on the price chart as arrows/icons with text labels for maximum clarity while reviewing history and live setups.

Options include:

  • show/hide on-chart signals
  • show/hide labels
  • compact label format (example: RD↑)
  • label/marker offset in pips for clean placement

3) Optional Oscillator Markers

If you prefer the classic Woodie feel, you can enable optional signal markers inside the CCI pane (points/dots).
This is fully optional so the oscillator stays clean when you only want chart-level signals.

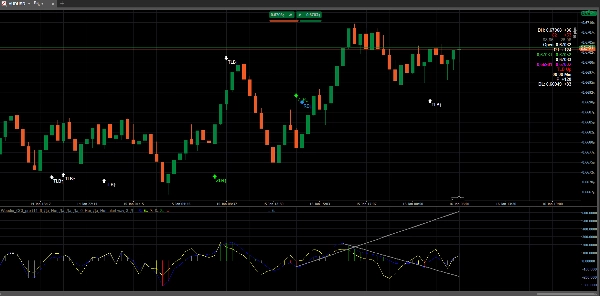
4) TLB Trendline Guidance in CCI Pane (No Scale Issues)

For better structure recognition, the indicator can draw TLB trendlines inside the CCI pane:

  • Current TLB lines (latest swing-to-swing guidance)
  • Keep On Signal option to preserve the trendline used at the moment of a breakout for later review

Rendering is designed to stay clean on history and avoid “edge” artifacts or forced scaling.

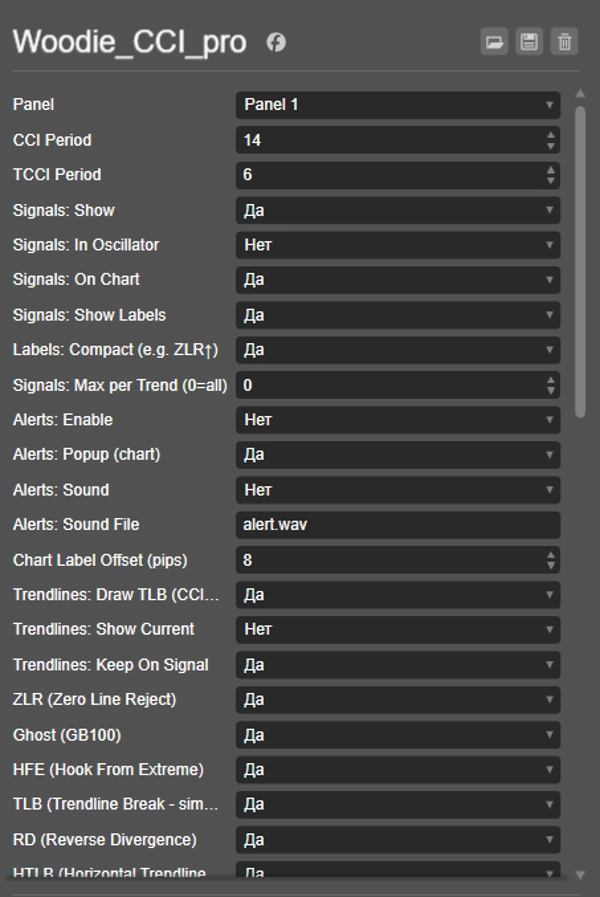
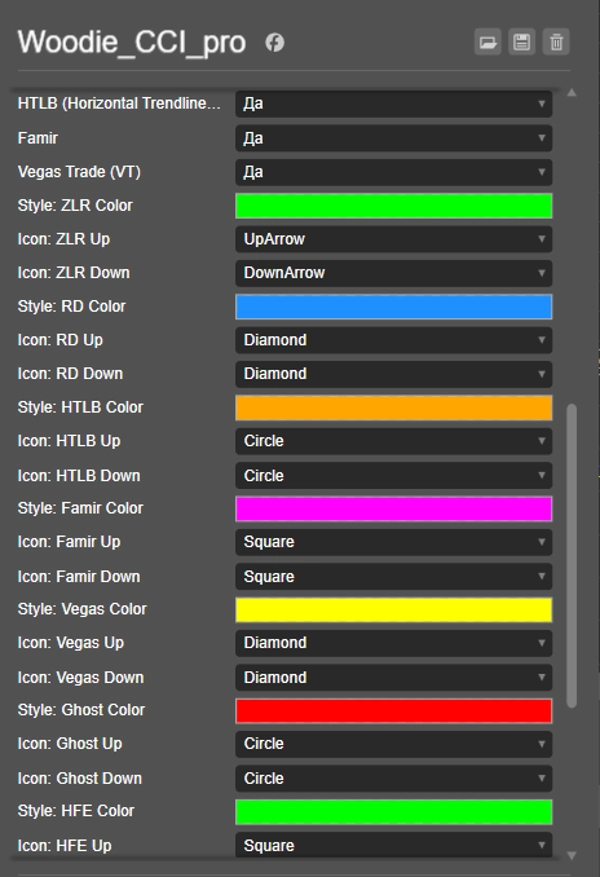
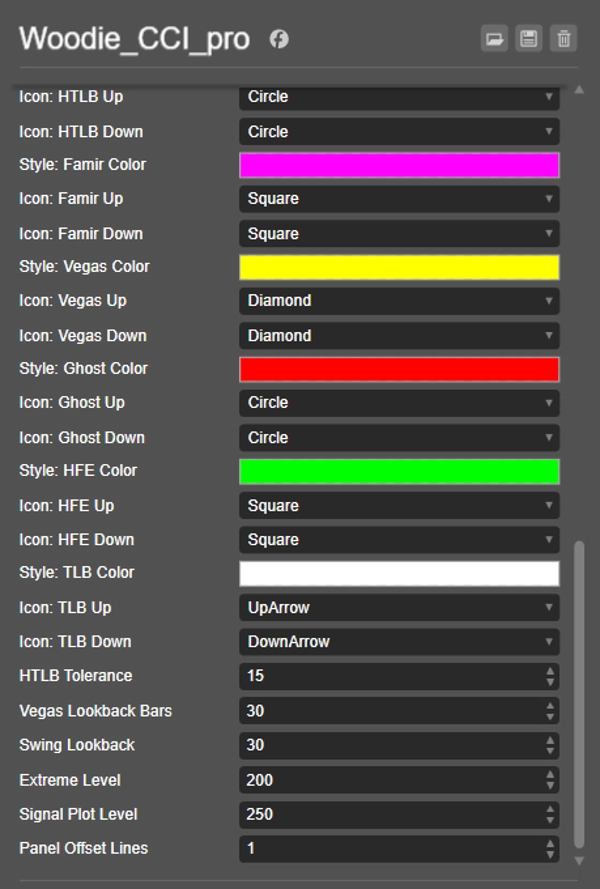
5) Style & Visualization Controls (Per Pattern)

You can customize visual appearance per pattern:

  • icon type for Up/Down
  • color per pattern (where supported)
  • compact vs full labels

6) Alerts (Optional)

Enable alerts for selected signals:

  • on-chart popup style message
  • optional sound notification (if supported by your platform setup)

7) “Max Signals Per Trend” Filter (Optional)

To reduce noise, you can limit signals per trend:

  • Max per Trend (0 = unlimited)
  • counts only signals aligned with the current trend (based on TCCI sign)


Typical Workflow

  1. Add Woodie_CCI_pro to a chart.
  2. Enable On Chart Signals and Labels to quickly study pattern behavior on history.
  3. Turn on TLB trendlines if you want structural context for breaks and continuation trades.
  4. Optionally enable Oscillator Markers if you prefer classic Woodie-dot confirmation.


Notes & Philosophy

  • This indicator aims to be practical and readable rather than “over-fitted”.
  • Some patterns (especially line-based ones like TLB/HTLB/RD/Vegas) include adjustable tolerances/lookbacks because market structure differs across symbols/timeframes.
  • Visual output is optimized for clean history, stable scaling, and minimal clutter.
Indicator profile
0.0
Reviews: 0
Customer reviews
No reviews for this product yet. Already tried it? Be the first to tell others!
BTCUSD
Forex
Signal
Scalping
Indices
EURUSD
NZDUSD
Crypto
AI
XAUUSD
NAS100
USDJPY
Products available through cTrader Store, including trading bots, indicators and plugins, are provided by third-party developers and made available for informational and technical access purposes only. cTrader Store is not a broker and does not provide investment advice, personal recommendations or any guarantee of future performance.

More from this author

Wave Weis Bar Force - is an indicator that applies the logic of Volume waves (Weis) to determine accumulation
Gann Pivot Vision is an innovative analytical tool that combines classic pivot reversal levels and Gann geometry
The Woodie CCI Indicator (Woodie Commodity Channel Index) is a variation of the classic CCI indicator
The Wyckoff Schematic Indicator is a professional-grade market structure tool designed to automatically detect
SigmaTrend Oscillator is an advanced momentum-based trend identification tool that combines dynamic price

You may also like

🧠Visually marks momentum zones when the RSI crosses the overbought/oversold thresholds (default 70/30). ✅
Traders Panel: Scan 15 pairs across 5 timeframes. Live heatmap, strength rankings and best setups in one panel.
🇫🇷 Visualisez vos sessions de marché et OPR d'un coup d’œil 🇬🇧 Visualize your market sessions & OPR at a glance !
The Support & Resistance Pro helps traders identify key support and resistance levels for informed trading decisions.
Order Block PRO — Smart Institutional Zone Detector
One of the best indicators we have ever developed, with a very high profit ratio.
(ViPi) MTF Candle displays multiple higher timeframe candles right on your current chart for ultimate trend analysis.
Visualize trading volume by price within any range, highlight POC and key value areas.
Overlay a real-time higher-timeframe candle on your chart — color-coded bias without switching TFs.
Market Structure Indicator – Your Trading Map in a Noisy Market. No more Panicking Which one, Where, Why and How.
cTreder Smart SMA
Smart Price Action Scanner 🔍 Detects engulfing, pin bars & inside bars with trend filter for cleaner entries ✅
🎯 Order Block Detector - Smart Trading: Identifica bloques de órdenes clave en cTrader para un trading más inteligente.
Alerts you when price touches Fibonacci levels. Stay organized and trade efficiently!
"VWAP Pro" logo
5.0
(4)
Free
Advanced VWAP with up to 30 anchored levels, multiple timeframes, memory mode, standard deviation bands & simple GUI
Price action to detect when the market changes trend (MSB) and defines, order blocks , ZigZag etc.📊
The Structure Fractal indicator is designed to identify and visualize key market structure points
This indicator is a combination of MACD and RSI into one. This is perfect fusion and powerful indicator ever.
Since 24/10/2025
1.08M
Traded volume
3.12K
Pips won
2
Sales
238
Free installs