
Description
TSPivotSMC-V2: The Fusion of Classical Pivots & Institutional Liquidity
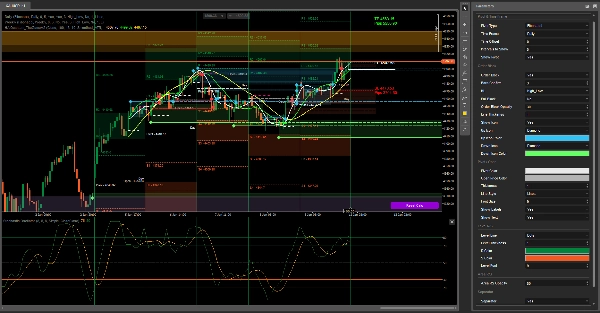
TSPivotSMC-V2 is not just another pivot point indicator; it's an advanced Smart Money Concepts (SMC) map designed for traders seeking institutional precision. We've transformed the most trusted tool of classic technical analysis into a liquidity detection engine and high-probability zones.
Key Features:
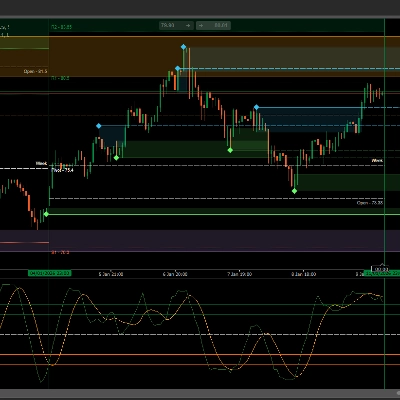
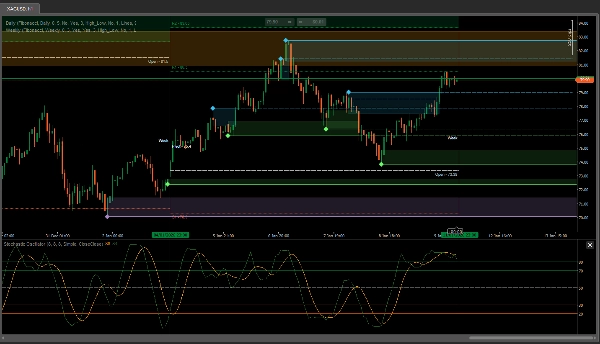
• Automatic Session Order Blocks: Identifies and draws rectangles at the previous session's high and low levels, marking critical supply and demand zones.
• Intelligent Mitigation Management: The indicator detects when a block has been broken by price, changing the solid rectangle to a dashed reference line. This allows you to maintain a clean chart while preserving historical breakouts.
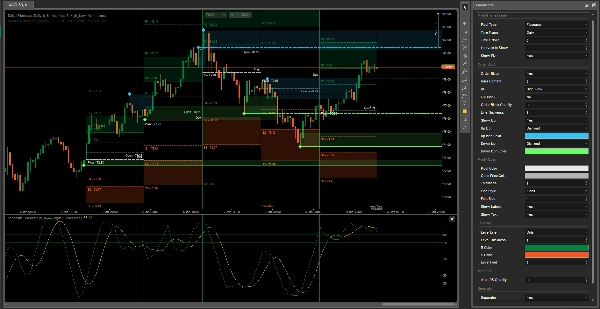
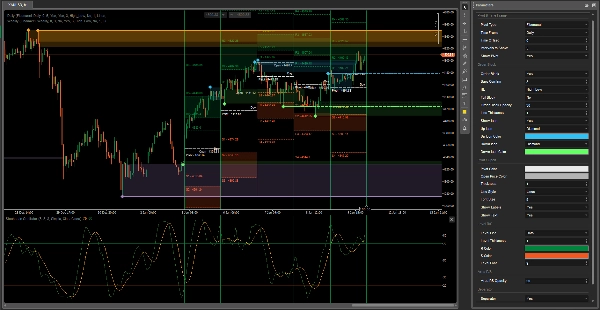
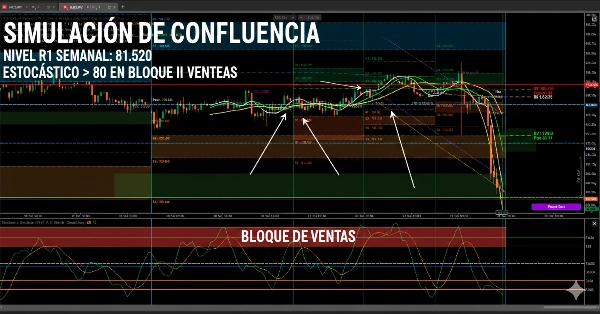
• Multi-Timeframe (MTF) Hierarchy: Designed to work in layers. You can apply a Daily instance for precise entries and a Weekly instance to define market bias, allowing you to see high-impact confluences.
• Professional Confirmation: Includes a candlestick confirmation filter (Bars Confirm) to ensure that liquidity zones are valid and not simply market noise.
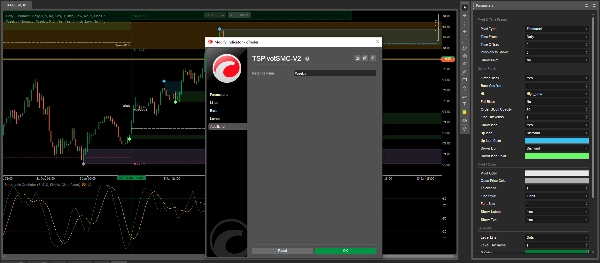
• Full Aesthetic Customization: Configure colors, opacities, and line styles independently for each timeframe, facilitating quick price reading under pressure.
Why choose TSPivotSMC?
While traditional pivots only give you numbers, TSPivotSMC-V2 gives you the market narrative. By combining mathematical Fibonacci/Standard levels with institutional price action, you can see where the money is and when it has been mitigated, giving you a unique competitive advantage on cTrader.
Note for store users: "Using two instances of the indicator (Daily and Weekly) is recommended to maximize the effectiveness of liquidity analysis on higher timeframes."
Summary
Designed for multi-timeframe analysis, TSPivotSMC-V2 supports layering daily and weekly instances to refine entry points and define overall market bias. It includes a candlestick confirmation filter to validate liquidity zones and reduce noise. Users can customize colors, opacities, and line styles independently for each timeframe to enhance visual clarity under trading pressure.
By combining mathematical pivot levels with institutional price action, this tool provides a detailed market narrative, helping traders identify where liquidity resides and when it has been mitigated. It is applicable across multiple markets including Forex, indices, commodities, cryptocurrencies, and stocks. Using multiple timeframe instances is recommended to maximize liquidity analysis effectiveness.
Customer reviews
5 | 100 % | |
4 | 0 % | |
3 | 0 % | |
2 | 0 % | |
1 | 0 % |