
RT Consolidation Zones
อินดิเคเตอร์
1 การซื้อ
เวอร์ชัน 1.0, Sep 2024
Windows, Mac
คำอธิบาย
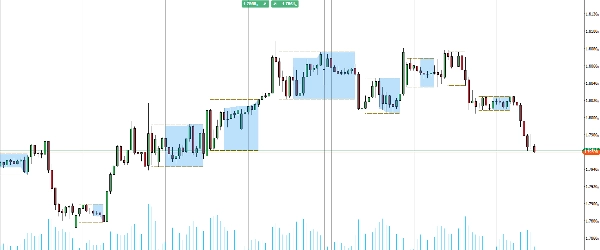
ขอแนะนำ ตัวบ่งชี้ Consolidation Zones ที่ออกแบบมาเพื่อช่วยให้คุณระบุและใช้ประโยชน์จากโอกาสในการเบรกเอาท์ได้อย่างง่ายดาย
เครื่องมือที่ทรงพลังนี้เน้นโซนบนแผนภูมิของคุณที่ราคากำลังรวมตัวกัน ทำให้ง่ายต่อการสังเกตจุดเบรกเอาท์ที่เป็นไปได้ โดยการแสดงภาพพื้นที่สำคัญเหล่านี้ คุณจะสามารถคาดการณ์การเคลื่อนไหวของตลาดได้ดีขึ้นและตัดสินใจซื้อขายอย่างมีข้อมูลมากขึ้น
เหมาะสำหรับเทรดเดอร์ที่ต้องการพัฒนากลยุทธ์ด้วยข้อมูลเชิงลึกที่ชัดเจนและนำไปใช้ได้จริง อัปเกรดชุดเครื่องมือการซื้อขายของคุณและเชี่ยวชาญการเบรกเอาท์ด้วยตัวบ่งชี้ Consolidation Zones
สรุป
โปรไฟล์อินดิเคเตอร์
รีวิวจากลูกค้า
0.0
รีวิว: 0
รีวิวจากลูกค้า
ยังไม่มีรีวิวสำหรับผลิตภัณฑ์นี้ หากเคยลองแล้ว ขอเชิญมาเป็นคนแรกที่บอกคนอื่น!
การสนทนา
คำถามที่พบบ่อย
BTCUSD
Forex
Breakout
Indices
EURUSD
Commodities
GBPUSD
NZDUSD
Prop
Crypto
Stocks
XAUUSD
NAS100
USDJPY
ผลิตภัณฑ์ที่มีให้บริการผ่าน cTrader Store รวมถึงบอทการเทรด อินดิเคเตอร์ และปลั๊กอิน มีให้บริการโดยนักพัฒนาบุคคลที่สามและมีไว้เพื่อวัตถุประสงค์ในการเข้าถึงข้อมูลและทางเทคนิคเท่านั้น cTrader Store ไม่ใช่โบรกเกอร์และไม่ได้ให้คำแนะนำการลงทุน คำแนะนำส่วนบุคคล หรือการรับประกันผลการดำเนินงานในอนาคต


!["[Stellar Strategies] Market Session Ultimate" โลโก้](https://cdn.ctrader.com/image/webp/61ffd537-0125-4246-9e72-42eca1791d64_28232)
ราคา
ตั้งแต่ 25/09/2024
20
การขาย