
TradingViewMACD
Indikator
3 pembelian
Versi 1.0, Feb 2025
Windows, Mac
5.0
Ulasan: 1

Penerangan
Penunjuk TradingViewMACD
Tingkatkan strategi dagangan anda dengan penunjuk TradingViewMACD kami yang sangat boleh disesuaikan, direka untuk platform cAlgo. Alat yang berkuasa ini menggabungkan fleksibiliti dan ketepatan yang diperlukan untuk mengoptimumkan analisis pasaran anda.
Ciri-ciri Utama:
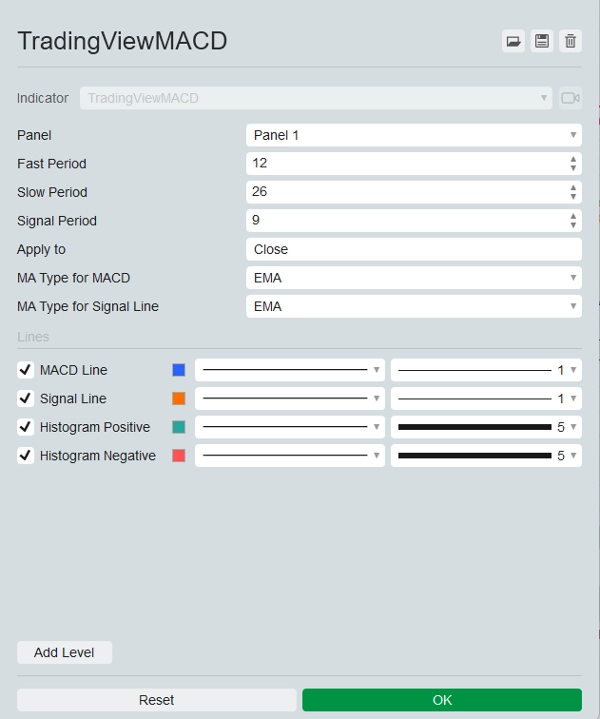
- Parameter Boleh Disesuaikan:
-
- Tempoh Pantas: Laraskan tempoh purata bergerak pantas mengikut gaya dagangan anda.
- Tempoh Perlahan: Konfigurasikan tempoh purata bergerak perlahan untuk ketepatan isyarat yang dipertingkatkan.
- Tempoh Isyarat: Tetapkan tempoh garis isyarat untuk melaras titik masuk dan keluar anda dengan tepat.
- Harga Digunakan: Pilih dari harga buka, tinggi, rendah, tutup, median, tipikal, atau berat untuk digunakan pada penunjuk.
- Pelbagai Jenis Purata Bergerak:
-
- Pilih antara Purata Bergerak Mudah (SMA) dan Purata Bergerak Eksponen (EMA) untuk kedua-dua garis MACD dan garis isyarat, memberikan fleksibiliti dalam analisis anda.
- Output Visual:
-
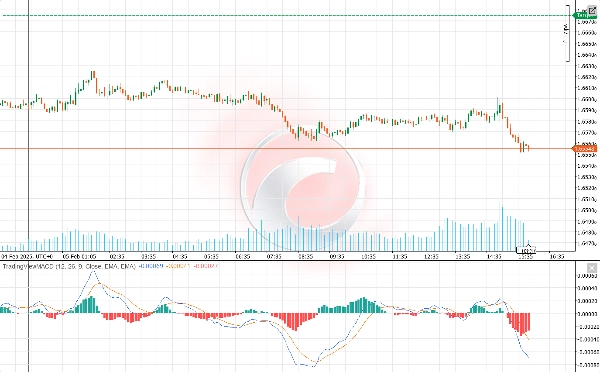
- Garis MACD: Dipaparkan dalam warna biru yang menarik untuk keterlihatan yang jelas.
- Garis Isyarat: Diserlahkan dalam warna jingga terang untuk membezakan dengan mudah daripada garis MACD.
- Histogram: Membezakan antara nilai positif dan negatif dengan warna hijau dan merah masing-masing, menawarkan representasi visual yang jelas tentang momentum pasaran.
- Wawasan Pasaran yang Dipertingkatkan:
-
- Penunjuk mengira perbezaan antara purata bergerak pantas dan perlahan untuk menghasilkan garis MACD.
- Mengira garis isyarat sebagai purata bergerak garis MACD.
- Histogram mewakili secara visual perbezaan antara garis MACD dan garis isyarat, membantu anda mengenal pasti isyarat beli dan jual yang berpotensi.
- Mesra Pengguna:
-
- Mudah dipasang dan dikonfigurasikan, membolehkan pedagang dari semua peringkat mendapat manfaat daripada ciri-ciri canggihnya.
- Dokumentasi menyeluruh dan sokongan pelanggan untuk memastikan pengalaman yang lancar.
Lepaskan potensi penuh strategi dagangan anda dengan penunjuk TradingViewMACD. Tingkatkan analisis pasaran anda, buat keputusan yang berinformasi, dan kekal di hadapan dengan alat dagangan penting ini.
Ringkasan
Ringkasan AI
The TradingViewMACD indicator for the cAlgo platform is a customizable technical analysis tool designed to enhance market analysis. It calculates the difference between fast and slow moving averages to generate the MACD line, computes a signal line as the moving average of the MACD line, and displays a histogram representing the difference between these lines to help identify potential buy and sell signals.
Key features include adjustable parameters such as fast period, slow period, signal period, and applied price (open, high, low, close, median, typical, or weighted). Users can select between Simple Moving Average (SMA) and Exponential Moving Average (EMA) types for both the MACD and signal lines, providing analytical flexibility.
Visual outputs consist of a blue MACD line, an orange signal line, and a histogram with green and red colors indicating positive and negative momentum, respectively. The indicator is designed for ease of installation and configuration, supported by comprehensive documentation and customer support to accommodate traders of all experience levels.
Profil indikator
Ulasan pelanggan
5.0
Ulasan: 1
5 | 100 % | |
4 | 0 % | |
3 | 0 % | |
2 | 0 % | |
1 | 0 % |
Ulasan pelanggan
November 9, 2025
TradingView MACD brings the familiar feel straight to cTrader 🚀 - smooth, light, and 100% accurate to the original. Perfect for traders switching from TV who love clean momentum signals. Missing alerts, but flawless for classic trend and divergence play.
Perbincangan
Soalan Lazim
Signal
MACD
Produk yang tersedia melalui cTrader Store, termasuk bot dagangan, indikator dan plugin, disediakan oleh pembangun pihak ketiga dan diberikan akses untuk tujuan maklumat dan teknikal sahaja. cTrader Store bukan broker dan tidak memberikan nasihat pelaburan, syor peribadi atau sebarang jaminan prestasi masa hadapan.


Harga
Sejak 22/11/2024
133
Jualan
2.58K
Pemasangan percuma