
Descrizione
ICT Killzones Complete – Analisi Professionale delle Sessioni di Trading
Padroneggia il timing del trading istituzionale con l'indicatore ICT Killzones più completo per cTrader. Questo strumento di livello professionale identifica e visualizza automaticamente tutte e cinque le sessioni critiche di trading ICT (Inner Circle Trader), dandoti il vantaggio di operare insieme al denaro intelligente.
Novità in Questa Versione:
- Tutte e 5 le Sessioni ICT: Copertura completa inclusi Asian Range, London Kill Zone, New York Kill Zone, NY Lunch/Reversal Zone e NY PM Kill Zone
- Sistema di Colori Intelligente: Nomi di colori semplici (Rosso, Blu, Arancione) invece di codici ARGB complessi
- Controlli di Trasparenza Indipendenti: Regola l'opacità per ogni sessione (0-100%)
- Colori delle Etichette Specifici per Sessione: Personalizza i colori delle etichette indipendentemente dai colori delle zone
- Descrizioni delle Sessioni: Etichette informative opzionali che spiegano le caratteristiche di ogni sessione
- Prestazioni Migliorate: Codice ottimizzato con pulizia automatica delle vecchie zone
Caratteristiche Principali:
📊 Copertura Completa delle Sessioni:
- Asian Range (19:00-00:00 NY): Identifica zone di consolidamento e pool di liquidità per raid successivi
- London Kill Zone (02:00-05:00 NY): Segna picchi di volatilità importanti ideali per cacce agli stop e inversioni
- NY Kill Zone (07:00-10:00 NY): Evidenzia la seconda mossa importante con forte slancio
- NY Lunch Zone (12:00-13:30 NY): Mostra periodi di inversione e consolidamento
- NY PM Kill Zone (13:30-16:00 NY): Cattura mosse secondarie e riequilibri di mercato
🎨 Personalizzazione Facile dei Colori:
- Nomi di colori semplici: basta digitare "Blu", "Arancione", "Viola", ecc.
- Oltre 50 colori predefiniti inclusi DodgerBlue, BlueViolet, MediumAquamarine
- Supporto per colori esadecimali (formato #RRGGBB)
- Slider di trasparenza individuali (0-100%) per ogni zona
- Colori separati per le etichette per massima chiarezza
⚙️ Opzioni di Visualizzazione Potenti:
- Attiva/disattiva singole sessioni
- Mostra/nascondi etichette informative delle sessioni
- Dimensione del font regolabile (6-20)
- Estendi le zone fino al bordo del grafico o mantienile contenute
- Controlla quanti giorni di storico visualizzare (1-30 giorni)
- Pulizia automatica per evitare ingombro del grafico
🎯 Design Professionale:
- Visualizzazione pulita e non invasiva
- Tracciamento dinamico di massimi/minimi durante le sessioni attive
- Gestione corretta delle sessioni overnight
- Funziona su tutti i timeframe
- Zero lag, prestazioni ottimizzate
Ideale Per:
- Trader della metodologia ICT in cerca di timing preciso
- Trader smart money che seguono i flussi istituzionali
- Day trader e scalper che necessitano di confini di sessione esatti
- Swing trader che identificano zone chiave di inversione
- Chiunque voglia allineare le operazioni con le principali sessioni di mercato
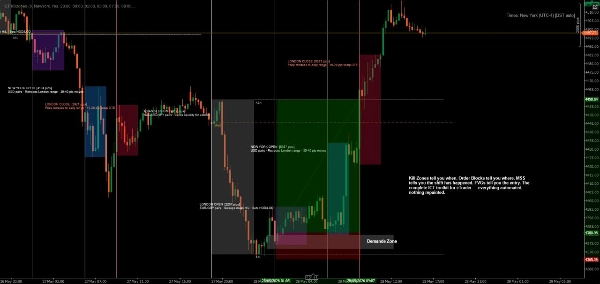
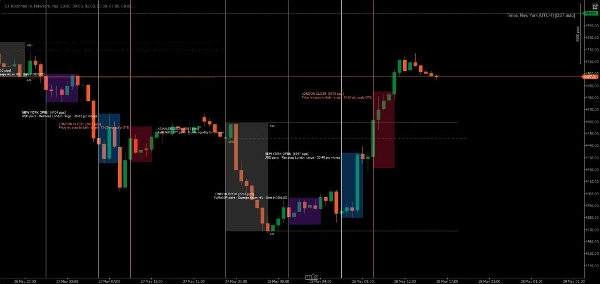
Come Funziona:
L'indicatore rileva automaticamente ogni giorno di trading e crea zone codificate a colori per tutte e cinque le sessioni ICT. Man mano che il prezzo si muove attraverso ogni sessione, l'indicatore traccia il massimo e il minimo, quindi disegna la zona finale quando la sessione si chiude. Le etichette identificano chiaramente ogni sessione e opzionalmente mostrano le sue caratteristiche di trading.
Tutti gli orari sono in ora di New York (Eastern), seguendo la metodologia standard ICT.
Esempi di Personalizzazione:
- Configurazione Conservativa: Bassa trasparenza (20-30%), colori sobri, nessuna info sulla sessione
- Configurazione Audace: Alta trasparenza (70-80%), colori vivaci, descrizioni complete delle sessioni
- Configurazione Minima: Disattiva le sessioni indesiderate, mantieni solo le tue killzone preferite
- Strategia Codificata a Colori: Abbina i colori delle zone al tuo bias di trading (verde = long, rosso = short)
Requisiti di Sistema:
- Piattaforma: cTrader Desktop (i prodotti del cTrader Store non sono supportati sulle versioni Web o Mobile) blog.ctrader.com
- Sistema Operativo: Windows 7 o superiore
- Processore: CPU dual-core consigliata
- Memoria: Minimo 2 GB RAM (4 GB consigliati)
- Connessione Internet: 50 kB al secondo o più veloce
Istruzioni per l'Installazione:
- Acquista/Installa: Ottieni l'indicatore dal cTrader Store
- Scarica cTrader Desktop: Se non è già installato, scaricalo da ctrader.com
- Accedi: Apri cTrader Desktop e accedi con il tuo ID cTrader
- Accedi all'Indicatore: Naviga nella sezione "Algo" → lista "Indicators"
- Aggiungi al Grafico: Clic destro su qualsiasi grafico → "Indicators" → Seleziona "ICT Killzones Complete"
- Personalizza: Clic destro sul nome dell'indicatore nel grafico → "Settings" per regolare colori, orari e opzioni di visualizzazione
Consigli per i Migliori Risultati:
- Usa timeframe da 1 minuto a 1 ora per una visibilità ottimale
- Combina con price action e concetti di liquidità per i migliori risultati
- Regola gli orari delle sessioni se il tuo broker usa fusi orari diversi
- Sperimenta con la trasparenza per trovare il tuo equilibrio visivo perfetto
- Abilita le etichette informative delle sessioni durante l'apprendimento, disabilitale per grafici più puliti
Fai trading con precisione. Fai trading con fiducia. Fai trading alla maniera ICT.
Nota: Questo indicatore è a scopo educativo e informativo. Le performance passate non garantiscono risultati futuri. Pratica sempre una corretta gestione del rischio.
Riepilogo
The indicator tracks high and low prices during active sessions and finalizes zones upon session close, providing clear visual boundaries for institutional trading timing. It supports all timeframes, handles overnight sessions properly, and includes automatic cleanup of old zones to maintain chart clarity. Customization options include font size adjustment, zone extension control, and history length for displayed zones. ICT Killzones Complete is suitable for traders using ICT methodology, smart money concepts, scalping, day trading, and swing trading across markets such as Forex, commodities, and crypto. It requires cTrader Desktop on Windows 7 or higher with recommended hardware specifications.
Recensioni dei clienti
5 | 50 % | |
4 | 25 % | |
3 | 0 % | |
2 | 25 % | |
1 | 0 % |


