
LT Flexible Volume Profile
Индикатор
12 покупки
Версия 1.0, Sep 2024
Windows, Mac
5.0
Отзывы: 3
Описание
Примечание: тестировалось только на cTrader для Windows.
Профиль объема
Вертикальный профиль, отображаемый на графике цены, показывающий, при какой цене объем больше/меньше (торговый интерес).
Индикатор гибкого профиля объема
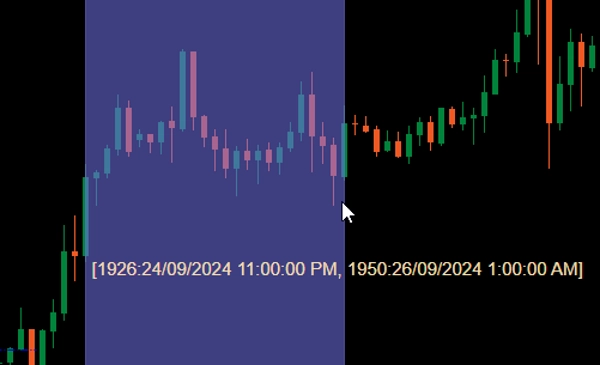
При добавлении на график, удерживайте Ctrl и перетащите левую кнопку мыши по области на графике цены, чтобы построить профиль для этой области.
Для повышения производительности профиль будет построен в 2 состояниях:
- Грубый профиль: индикатор использует таймфрейм, заданный параметром CoarseTF (по умолчанию m5) для загрузки информации об объеме, это обычно быстро. Пока отображается грубый профиль, тонкий профиль загружается в фоновом режиме.
- Тонкий профиль: более точный профиль, использующий таймфрейм, заданный FineTF (по умолчанию m1), но вы можете установить его на самый точный (t1 - отдельный тик). Однако, если вы смотрите дневной или более длинный таймфрейм, установка на тиковый таймфрейм увеличит время загрузки.
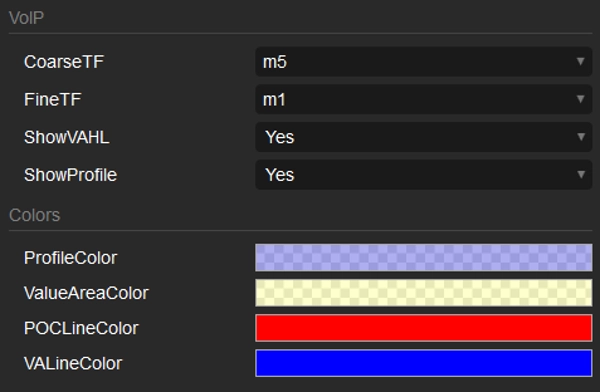
Параметры
- CoarseTF: таймфрейм для грубых данных (по умолчанию m5).
- FineTF: таймфрейм для тонких данных (по умолчанию m1).
- ShowVAHL: отображает VAH (Value Area High) и VAL (Value Area Low).
- ShowProfile: если Да, отображается полный профиль, иначе только VAH, VAL и POC (точка контроля).
- Colors: настройка цветов.
Как использовать
После добавления индикатора на график цены используйте Ctrl + перетаскивание левой кнопкой мыши, чтобы выбрать область на графике, для которой хотите построить профиль, и всё.
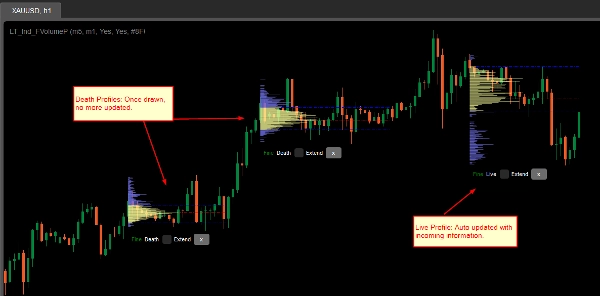
После построения профиля внизу профиля вы увидите некоторую информацию/элементы управления:
- Coarse/Fine: состояние профиля.
- Death/Live: если ваш профиль охватывает последний бар (свечу), то это живой профиль, который автоматически обновляется с поступающей информацией.
- Флажок Extend: отметьте, чтобы линии VAH, VAL и POC продолжались до последнего бара (свечи).
- Кнопка x: нажмите, чтобы удалить профиль с графика.
Сводка
ИИ-сводка
LT Flexible Volume Profile is a volume profile indicator designed for use on price charts, primarily tested on cTrader Windows. It visually represents trading volume distribution across price levels within a selected chart area, highlighting where trading interest is higher or lower.
Users activate the profile by holding Ctrl and dragging the mouse over a desired chart region. The indicator operates in two modes for performance optimization: a Coarse profile using a configurable timeframe (default 5 minutes) for faster loading, and a Fine profile using a finer timeframe (default 1 minute, with an option down to single ticks) for more precise volume data.
Key parameters include:
- CoarseTF and FineTF: timeframes for coarse and fine volume data aggregation.
- ShowVAHL: toggles display of Value Area High (VAH) and Value Area Low (VAL).
- ShowProfile: controls whether the full profile or only key levels (VAH, VAL, Point of Control) are shown.
- Colors: customizable color settings.
After rendering, the profile provides status indicators (Coarse/Fine, Live/Dead), options to extend VAH, VAL, and POC lines to the latest bar, and the ability to remove the profile. This tool supports detailed volume analysis to assist traders in identifying significant price levels based on traded volume.
Профиль индикатора
Отзывы покупателей
5.0
Отзывы: 3
5 | 100 % | |
4 | 0 % | |
3 | 0 % | |
2 | 0 % | |
1 | 0 % |
Отзывы покупателей
October 1, 2024
Sensible product to test around volume based context. The useful part is checking participation, value areas and pressure, with the numbers checked before scaling. I would review 20 reactions near POC or VWAP before trusting the read. The data helps most when price action confirms the same zone.
September 30, 2024
September 30, 2024
Good tool for patience if the trader wants it adds useful information behind the price move. It works best as support, not a final decision maker. Volume context is stronger when POC, VWAP and value area agree across 2 sessions. volume alone can be noisy without price action.
Обсуждение
Частые вопросы
Forex
Продукты, доступные в cTrader Store, включая торговых ботов, индикаторы и плагины, предоставляются сторонними разработчиками и доступны исключительно в информационных и технических целях. cTrader Store не является брокером и не предоставляет инвестиционные консультации, персональные рекомендации или какие-либо гарантии будущей доходности.


Цена
С 25/09/2024
34
Продажи