
Описание
Примечание: тестировалось только на cTrader для Windows.
LT_Ind_Pivot — мощный настраиваемый индикатор Pivot Point для cTrader, который помогает визуализировать ключевые уровни рынка и структуру сессий на нескольких таймфреймах.
Он автоматически рассчитывает и отображает Pivot (P), Support (S1–S5), Resistance (R1–R5) и CPR (TC/BC) уровни на основе выбранного вами якорного таймфрейма — от H1, H4, H8, H12, D1, W1 до Month1.
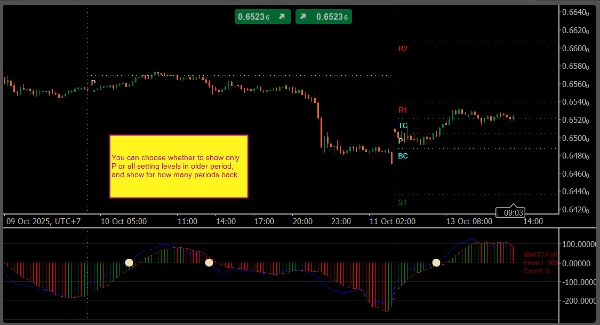
Индикатор также рисует вертикальные разделительные линии для каждого якорного периода как на основном графике, так и на панелях индикатора, что облегчает различение границ сессий или периодов.
Вы можете точно задать, какие уровни показывать, используя гибкую нотацию, такую как:
P, S1, R1– стандартные уровниPS1,S1S2,R1R2и т.д. – промежуточные уровни между пивотами и основными уровнями поддержки/сопротивленияTC,BC– Центральный диапазон пивота (CPR)
Элементы управления отображением позволяют задать, сколько исторических пивотов оставлять видимыми, показывать ли текстовые/ценовые метки и как окрашивать или стилизовать каждый уровень.
Основные функции
- Якоря пивотов: H1, H4, H8, H12, D1, W1, Month1
- Синтаксис пользовательских уровней:
P, Sx, Rx, PS1, S1S2, R1R2, TC, BC - Вертикальные разделители периодов на графике и панелях индикатора
- Возможность отображать текст, цены и старые уровни пивотов
- Полная настройка цветов и стилей линий
- Легкий и подходящий для торговли в реальном времени
Настройки по умолчанию
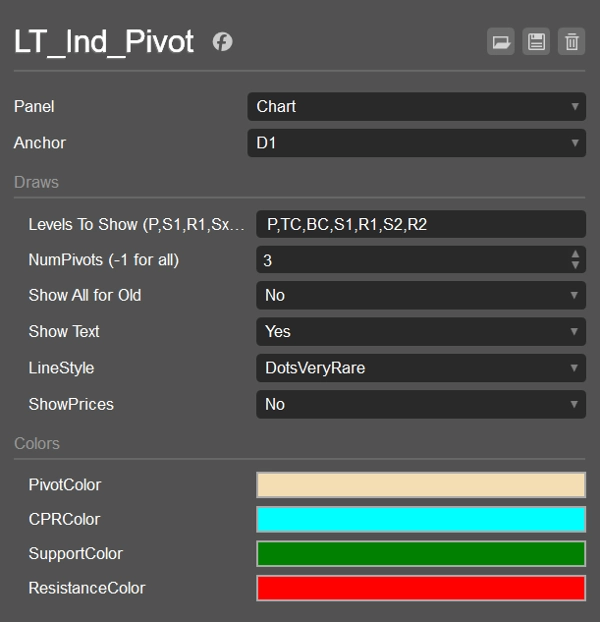
- Якорь: D1
- Показывать уровни:
P,S1,R1 - NumPivotsBack: 1
- ShowAllForOldPivots: false
- Показывать текст: true
- Показывать цены: false
- Стиль линии: Solid
- Цвета: Pivot = Wheat, CPR = Cyan, Support = Green, Resistance = Red
Сценарии использования
- Отмечать внутридневные и свинговые зоны поддержки/сопротивления
- Отслеживать CPR и промежуточные уровни для настроек прорыва или возврата к среднему
- Использовать разделители периодов для анализа структуры сессий по отдельности
- Комбинировать с VWAP или индикаторами Swing для большей конгруэнтности
Сводка
Отзывы покупателей
5 | 0 % | |
4 | 100 % | |
3 | 0 % | |
2 | 0 % | |
1 | 0 % |


