
Automatic Fibonatti
مؤشر
3 عمليات الشراء
الإصدار 1.2، Apr 2026
Windows, Mac
5.0
التقييمات: 2
الوصف
فيبوناتشي التلقائي لـ cTrader
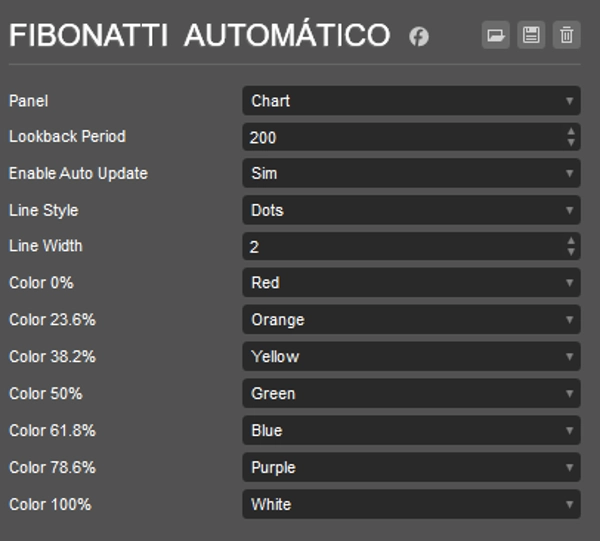
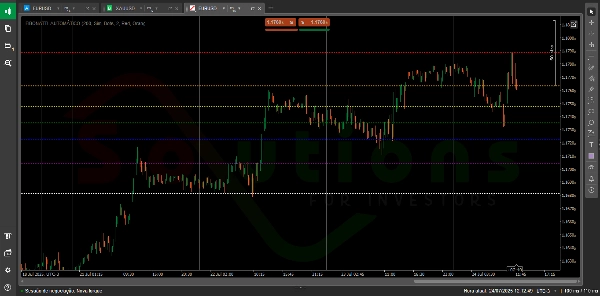
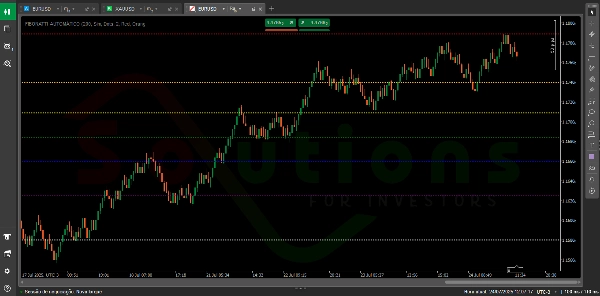
تحديد مستويات السعر الرئيسية تلقائيًا — قابلة للتخصيص بالكامل وفقًا لاستراتيجيتك.
فيبوناتشي التلقائي هو مؤشر ذكي ومرن يرسم تلقائيًا مستويات تصحيح فيبوناتشي بناءً على أعلى وأدنى الأسعار خلال فترة يحددها المستخدم. ما يميزه هو التخصيص الكامل: تخصيص كل مستوى فيبوناتشي من حيث اللون، ونمط الخط، والسماكة لتناسب تفضيلاتك البصرية واستراتيجيتك في التداول. كما يتميز بـ التحديثات في الوقت الحقيقي، بحيث يعكس الرسم البياني الخاص بك دائمًا أحدث حركة سعرية — دون الحاجة إلى تعديلات يدوية.
الملخص
ملف تعريف المؤشر
تقييمات العملاء
5.0
التقييمات: 2
5 | 100 % | |
4 | 0 % | |
3 | 0 % | |
2 | 0 % | |
1 | 0 % |
تقييمات العملاء
March 7, 2025
The product earns time when it gives the trader a reason to pause. It should not replace the chart.
February 28, 2025
there is less room for random clicking, but manual context is still required.
مناقشة
الأسئلة الشائعة
BTCUSD
Forex
Signal
Indices
EURUSD
Commodities
GBPUSD
NZDUSD
Fibonacci
Prop
Scalping
Crypto
Stocks
XAUUSD
NAS100
USDJPY
يتم توفير المنتجات المتاحة من خلال cTrader Store، بما في ذلك روبوتات التداول والمؤشرات والإضافات، من قبل مطوري الطرف الثالث وإتاحتها لأغراض الوصول المعلوماتي والفني فقط. cTrader Store ليس وسيطًا ولا يقدم نصائح استثمارية أو توصيات شخصية أو أي ضمان للأداء المستقبلي.


السعر
منذ 05/02/2025
31
المبيعات