
LT_Ind_SRZones
مؤشر
3 عمليات الشراء
الإصدار 1.0، Oct 2025
Windows, Mac
4.6
التقييمات: 3
الوصف
ملاحظة: تم الاختبار على cTrader لنظام ويندوز فقط.
LT_Ind_SRZones يكتشف قمم/قيعان التأرجح، يدمج التأرجحات القريبة في مناطق الدعم/المقاومة، ويحافظ على تركيز الرسم البياني الخاص بك على المستويات الأكثر صلة حول السعر الحالي.
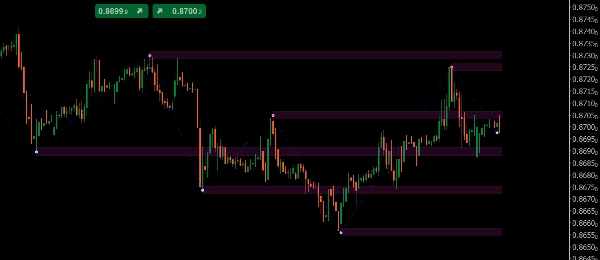
ما يرسمه
- مناطق: أشرطة مظللة مبنية من التأرجحات المدمجة
- نقاط القمة/القاع
- زيغزاغ مسار لقراءة الهيكل بسرعة
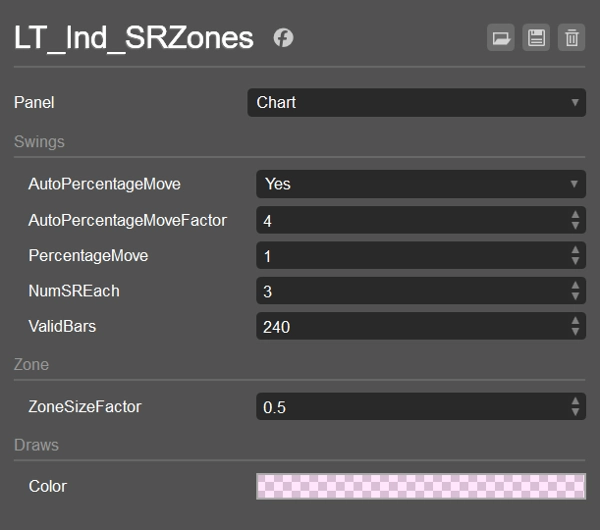
الضوابط الرئيسية
- AutoPercentageMove (bool) + AutoPercentageMoveFactor (double)
يضبط حساسية التأرجح تلقائيًا. قم بإيقاف التشغيل لاستخدام PercentageMove يدويًا. - PercentageMove (double)
الحد الأدنى للحركة (كنسبة مئوية) لتشكيل تأرجح عندما يكون Auto متوقفًا. - ZoneSizeFactor (double)
ارتفاع المنطقة =ZoneSizeFactor × ATR. - NumSREach (int)
كم عدد المناطق العليا التي يجب الاحتفاظ بها فوق و تحت السعر الحالي. - ValidBars (int)
تجاهل التأرجحات الأقدم من هذا العدد من الأعمدة. - ألوان / أنماط العرض
لون تعبئة المنطقة (مع الشفافية)، أنماط التأرجح/الزيغزاغ.
ترتيب ومنطق التصفية (كيفية اختيار المناطق)
- جمع التأرجحات من الأحدث إلى الأقدم، فقط الدائمة و غير الأقدم من
ValidBars. - عد التأرجحات فوق و تحت السعر الحالي (بما في ذلك تلك التي تقع قيمتها داخل نصف المنطقة). توقف عندما يصل كلا الجانبين إلى
NumSREach. - خطة بديلة: إذا لم يكن لدى جانب تأرجح مؤهل، أضف تأرجحًا أقدم واحدًا لذلك الجانب.
- دمج: لكل تأرجح مؤهل، إما دمجه في منطقة موجودة (
CanMerge) أو إنشاء منطقة جديدة. - ترتيب واختيار:
-
- فوق السعر: فرز المناطق حسب (High − price) تصاعديًا، ثم حسب MostRecentIndex تنازليًا؛ اخذ
NumSREach. - تحت السعر: فرز حسب (price − Low) تصاعديًا، ثم حسب MostRecentIndex تنازليًا؛ اخذ
NumSREach. - اتحاد القائمتين → عرض المناطق النهائية.
- فوق السعر: فرز المناطق حسب (High − price) تصاعديًا، ثم حسب MostRecentIndex تنازليًا؛ اخذ
هذا يحافظ على العرض نظيفًا، قريبًا، وحديثًا، مع التعامل مع الحالات الحدية.
الإعدادات الافتراضية
- AutoPercentageMove = true، AutoPercentageMoveFactor = 4
- PercentageMove = 1.0 (يستخدم عندما يكون Auto = false)
- NumSREach = 1
- ValidBars = 240
- ZoneSizeFactor = 0.5 (ارتفاع المنطقة = 0.5 × ATR)
- لون المنطقة = #21FF33E0 (شبه شفاف)
- قمة التأرجح = #FFFF999A، قاع التأرجح = #FF99DFF9، زيغزاغ = أزرق (نقاط)
حالات الاستخدام
- تمييز مناطق الدعم/المقاومة القريبة للدخول، الجزئيات، أو التوقفات
- مراقبة تقلبات المنطقة (دعم → مقاومة والعكس بالعكس)
- الدمج مع VWAP/Pivots للتوافق
يعمل على أي رمز وزمن. خفيف الوزن وجاهز للتداول المباشر أو الاختبارات الخلفية.
الملخص
ملخص الذكاء الاصطناعي
LT_Ind_SRZones is an indicator designed for cTrader Windows that automatically identifies and displays support and resistance zones derived from swing highs and lows. It detects swing points, merges nearby swings into shaded support/resistance zones, and highlights the most relevant levels around the current price to maintain a clear chart view. The indicator also plots swing high/low points and a ZigZag path for quick structural analysis.
Key adjustable parameters include automatic or manual swing sensitivity settings, zone size based on a factor of the Average True Range (ATR), the number of top zones to display above and below the current price, and the maximum age of swings considered. The indicator filters and ranks zones by proximity and recency, ensuring the display focuses on recent and nearby levels.
LT_Ind_SRZones works on any symbol and timeframe, supporting markets such as Forex, indices, commodities, cryptocurrencies, and stocks. It is suitable for live trading and backtesting. Typical use cases include marking nearby support/resistance zones for trade entries, stops, or partial exits, monitoring zone flips (support to resistance and vice versa), and combining with other indicators like VWAP or pivots for confluence.
ملف تعريف المؤشر
تقييمات العملاء
4.6
التقييمات: 3
5 | 67 % | |
4 | 33 % | |
3 | 0 % | |
2 | 0 % | |
1 | 0 % |
تقييمات العملاء
October 22, 2025
October 15, 2025
the routine feels easier to keep, but the chart still needs a human read.
مناقشة
الأسئلة الشائعة
Prop
Forex
Indices
Commodities
Crypto
Stocks
يتم توفير المنتجات المتاحة من خلال cTrader Store، بما في ذلك روبوتات التداول والمؤشرات والإضافات، من قبل مطوري الطرف الثالث وإتاحتها لأغراض الوصول المعلوماتي والفني فقط. cTrader Store ليس وسيطًا ولا يقدم نصائح استثمارية أو توصيات شخصية أو أي ضمان للأداء المستقبلي.


السعر
منذ 25/09/2024
34
المبيعات