
LT_FairValueGap
Wskaźnik
1 zakupy
Wersja 1.0, Jun 2025
Windows, Mac
5.0
Opinie: 1
Opis
Uwaga: Testowano tylko na cTrader Windows.
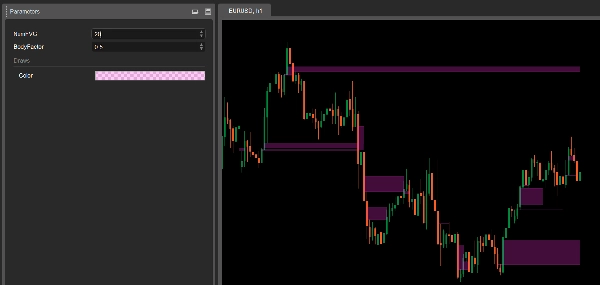
LT_FairValueGap to lekki i potężny wskaźnik Fair Value Gap zaprojektowany dla precyzyjnych traderów cenowych. Podkreśla strefy nierównowagi w stylu instytucjonalnym, wykorzystując ścisłą logikę 3 świec i usuwa je, gdy cena ponownie odwiedza lukę — dając czyste, praktyczne strefy do wejść, wyjść lub konfluencji.
🔍 Jak to działa
- Luka Fair Value Gap (FVG) jest identyfikowana, gdy silna środkowa świeca (z dużym korpusem) tworzy nierównowagę między dwoma sąsiednimi świecami.
- Luka jest oznaczana jako tymczasowa strefa wsparcia/oporu (SR).
- Gdy cena wraca i wypełnia lukę, strefa przestaje się rozszerzać — zapewniając, że wykresy pozostają przejrzyste i istotne.
⚙️ Parametry
- NumFVG: Maksymalna liczba stref FVG do wyświetlenia na wykresie.
- BodyFactor: Próg siły dla środkowej świecy (domyślnie:
2.0לrednia wielkość korpusu z ostatnich 20 świec).
✅ Kluczowe cechy
- Wykrywanie luk w stylu instytucjonalnym (logika 3 świec)
- Czyste wykresy — strefy przestają się rozszerzać po dotknięciu
- Regulowana czułość za pomocą BodyFactor
- Plug-and-play: minimalna konfiguracja
📌 Zastosowania
- Identyfikacja nierównowag instytucjonalnych i stref reakcji
- Użycie jako konfluencja wejścia lub wskaźnik unieważnienia
- Łączenie ze strukturą swing lub narzędziami wolumenowymi
Niezależnie od tego, czy handlujesz wybiciami, mitigacjami czy odwróceniami, LT_FairValueGap pomaga dostrzec prawdziwe strefy nierównowagi, które mają znaczenie — bez szumu.
Podsumowanie
Profil wskaźnika
Opinie klientów
5.0
Opinie: 1
5 | 100 % | |
4 | 0 % | |
3 | 0 % | |
2 | 0 % | |
1 | 0 % |
Opinie klientów
June 25, 2025
Ngl, market notes are quicker to compare and that is enough to keep testing it. It should not replace the chart.
Dyskusja
Częste pytania
Forex
Produkty dostępne za pośrednictwem cTrader Store, w tym boty handlowe, wskaźniki i wtyczki, dostarczane są przez deweloperów zewnętrznych i udostępniane wyłącznie w celach informacyjnych oraz w celu zapewnienia dostępu technicznego. cTrader Store nie jest brokerem i nie zapewnia doradztwa inwestycyjnego, nie udziela spersonalizowanych rekomendacji ani nie gwarantuje przyszłych wyników.


Cena
Od 25/09/2024
34
Sprzedaż