
LT_Ind_SRZones
Wskaźnik
3 zakupy
Wersja 1.0, Oct 2025
Windows, Mac
4.6
Opinie: 3
Opis
Uwaga: Testowano tylko na cTrader Windows.
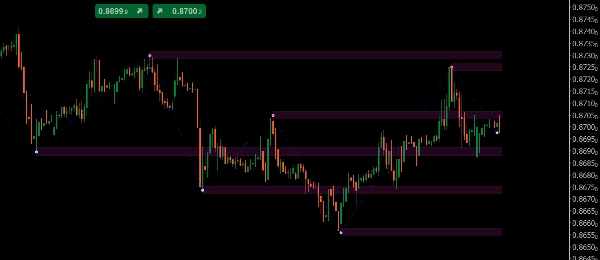
LT_Ind_SRZones wykrywa lokalne maksima/minima, łączy pobliskie oscylacje w strefy wsparcia/oporu i utrzymuje wykres skupiony na najbardziej istotnych poziomach wokół aktualnej ceny.
Co rysuje
- Strefy: zacienione pasma zbudowane z połączonych oscylacji
- Punkty lokalnych maksimów/minimów
- Ścieżka ZigZag do szybkiego odczytu struktury
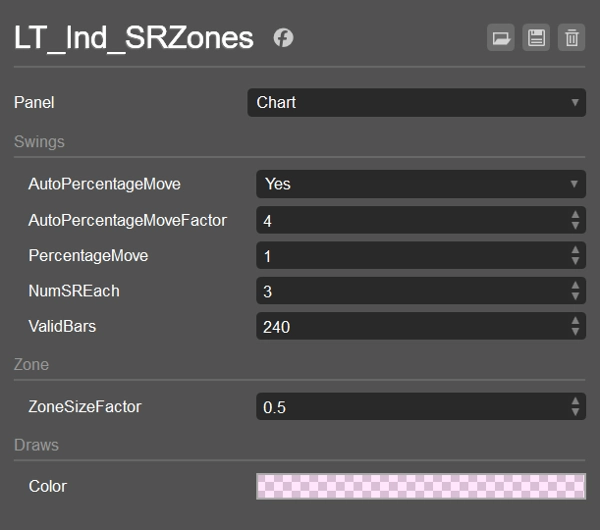
Kluczowe sterowanie
- AutoPercentageMove (bool) + AutoPercentageMoveFactor (double)
Automatycznie dostraja czułość oscylacji. Wyłącz, aby używać PercentageMove ręcznie. - PercentageMove (double)
Minimalny ruch (w %) do utworzenia oscylacji, gdy Auto jest wyłączone. - ZoneSizeFactor (double)
Wysokość strefy =ZoneSizeFactor × ATR. - NumSREach (int)
Ile najważniejszych stref utrzymać powyżej i poniżej aktualnej ceny. - ValidBars (int)
Ignoruj oscylacje starsze niż ta liczba świec. - Kolor / style wyświetlania
Kolor wypełnienia strefy (z przezroczystością), style oscylacji/ZigZag.
Logika sortowania i filtrowania (jak wybierane są strefy)
- Zbieraj oscylacje od najnowszych wstecz, tylko trwałe i nie starsze niż
ValidBars. - Zlicz oscylacje powyżej i poniżej aktualnej ceny (w tym te, których wartość mieści się w połowie strefy). Zatrzymaj, gdy obie strony osiągną
NumSREach. - Zapasowy plan: jeśli strona nie ma kwalifikującej się oscylacji, dodaj jedną starszą oscylację dla tej strony.
- Scalanie: dla każdej uprawnionej oscylacji, albo scalaj z istniejącą strefą (
CanMerge) albo stwórz nową strefę. - Ranking i wybór:
-
- Powyżej ceny: sortuj strefy według (High − price) rosnąco, następnie według MostRecentIndex malejąco; weź
NumSREach. - Poniżej ceny: sortuj według (price − Low) rosnąco, następnie według MostRecentIndex malejąco; weź
NumSREach. - Połącz dwie listy → wyświetlane ostateczne strefy.
- Powyżej ceny: sortuj strefy według (High − price) rosnąco, następnie według MostRecentIndex malejąco; weź
To utrzymuje wyświetlanie czyste, bliskie i aktualne, jednocześnie radząc sobie z przypadkami brzegowymi.
Domyślne ustawienia
- AutoPercentageMove = true, AutoPercentageMoveFactor = 4
- PercentageMove = 1.0 (używane, gdy Auto = false)
- NumSREach = 1
- ValidBars = 240
- ZoneSizeFactor = 0.5 (wysokość strefy = 0.5 × ATR)
- Kolor strefy = #21FF33E0 (półprzezroczysty)
- Lokalne maksimum = #FFFF999A, lokalne minimum = #FF99DFF9, ZigZag = niebieski (kropki)
Przypadki użycia
- Oznacz pobliskie strefy wsparcia/oporu do wejść, częściowych wyjść lub stopów
- Obserwuj zmiany stref (wsparcie → opór i odwrotnie)
- Łącz z VWAP/Pivotami dla potwierdzenia
Działa na dowolnym symbolu i interwale czasowym. Lekki i gotowy do handlu na żywo lub testów historycznych.
Podsumowanie
Podsumowanie AI
LT_Ind_SRZones is an indicator designed for cTrader Windows that automatically identifies and displays support and resistance zones derived from swing highs and lows. It detects swing points, merges nearby swings into shaded support/resistance zones, and highlights the most relevant levels around the current price to maintain a clear chart view. The indicator also plots swing high/low points and a ZigZag path for quick structural analysis.
Key adjustable parameters include automatic or manual swing sensitivity settings, zone size based on a factor of the Average True Range (ATR), the number of top zones to display above and below the current price, and the maximum age of swings considered. The indicator filters and ranks zones by proximity and recency, ensuring the display focuses on recent and nearby levels.
LT_Ind_SRZones works on any symbol and timeframe, supporting markets such as Forex, indices, commodities, cryptocurrencies, and stocks. It is suitable for live trading and backtesting. Typical use cases include marking nearby support/resistance zones for trade entries, stops, or partial exits, monitoring zone flips (support to resistance and vice versa), and combining with other indicators like VWAP or pivots for confluence.
Profil wskaźnika
Opinie klientów
4.6
Opinie: 3
5 | 67 % | |
4 | 33 % | |
3 | 0 % | |
2 | 0 % | |
1 | 0 % |
Opinie klientów
October 22, 2025
October 15, 2025
the routine feels easier to keep, but the chart still needs a human read.
Dyskusja
Częste pytania
Prop
Forex
Indices
Commodities
Crypto
Stocks
Produkty dostępne za pośrednictwem cTrader Store, w tym boty handlowe, wskaźniki i wtyczki, dostarczane są przez deweloperów zewnętrznych i udostępniane wyłącznie w celach informacyjnych oraz w celu zapewnienia dostępu technicznego. cTrader Store nie jest brokerem i nie zapewnia doradztwa inwestycyjnego, nie udziela spersonalizowanych rekomendacji ani nie gwarantuje przyszłych wyników.


Cena
Od 25/09/2024
34
Sprzedaż