
Açıklama
Bir Ticaret Sistemine Dönüşen Bir Gösterge
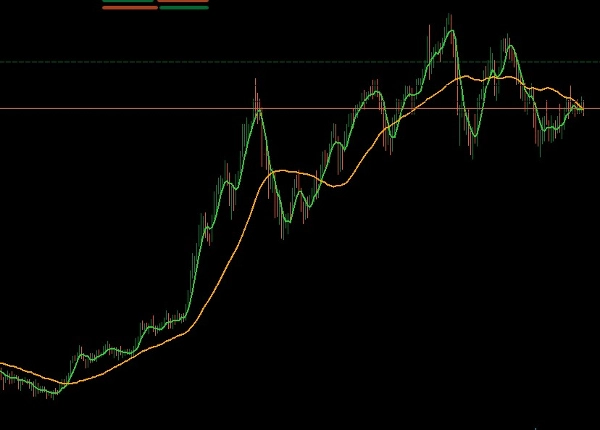
Bu gösterge, haftalık grafik üzerinde kullanıldığında gerçekten tam bir ticaret sistemine dönüşebilir. En büyük gücü, kısa zaman dilimlerine özgü piyasa gürültüsünü filtreleyerek size sadece ana, uzun vadeli yönü göstermesidir.
Trende Dayalı Bir Ticaret Stratejisi
Başarının ana koşulu, tüccarın yatay hareketin sonunu tanımlayabilme (konsolidasyon) yeteneğidir. Bir enstrüman nihayet bu belirsizlik döneminden çıkıp gösterge yeni bir yönü güvenle işaret ettiğinde, bu piyasaya girmek için mükemmel andır.
İşlem haftalık grafik üzerinde yapıldığı için, büyük bir trendi yakalamaya odaklanır. Sonuç olarak, trendin başlangıcında doğru şekilde piyasaya giren sabırlı bir tüccar, tek bir işlemden çok iyi bir kar elde edebilir. Bu gösterge, basit bir araçtan, beklemeye ve büyük trendlerde işlem yapmaya istekli olanlar için basit ama güçlü bir ticaret stratejisinin temeline dönüşür.
Özet
Müşteri değerlendirmeleri
5 | 0 % | |
4 | 100 % | |
3 | 0 % | |
2 | 0 % | |
1 | 0 % |


!["[Hamster-Coder] Bollinger Bands" logosu](https://cdn.ctrader.com/image/webp/21d8e5d6-fb11-4bac-b9ee-cd05c2b76804_30327)


