
Opis
Detektor Dużych Świec
(autor: Avydel Talbo – trader prop firm w The5%ers & OFP)
Teraz dostępny dla cTrader!
Oryginalnie opracowany dla MT5, ATR Big Candle Detector autorstwa Avydela Talbo to solidne narzędzie zaprojektowane, aby pomóc traderom efektywnie i dokładnie identyfikować główne strefy ruchu cenowego oraz istotne wzory świecowe.
Przegląd
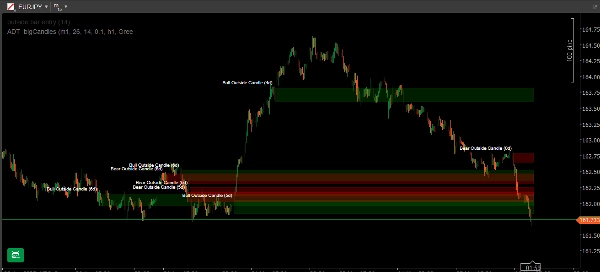
ATR Big Candle Detector skanuje Twoje wykresy w poszukiwaniu największych, najbardziej znaczących świec w określonym przez użytkownika okresie. Wykorzystując Average True Range (ATR) jako filtr zmienności, podkreśla te „duże świece” za pomocą trwałych, kolorowych prostokątów. Każda strefa jest oznaczona typem wzoru świecy oraz jej wiekiem, zapewniając jasny kontekst wizualny dla traderów na każdym poziomie zaawansowania.
Kluczowe Funkcje
- Filtrowanie oparte na ATR:
Wykrywa tylko świece przekraczające konfigurowalny próg ATR, skupiając się na naprawdę istotnych ruchach. - Wykrywanie wielu wzorów:
-
- Tryb standardowy: Znajduje wszystkie świece spełniające kryteria ATR.
- Tryb specjalny: Filtruje klasyczne wzory price action, takie jak Outside Bars, Engulfing Candles, Doji, Marubozu, Hammer, Shooting Star, Pin Bars oraz Spinning Top (automatycznie oznaczone).
- Trwałe prostokąty:
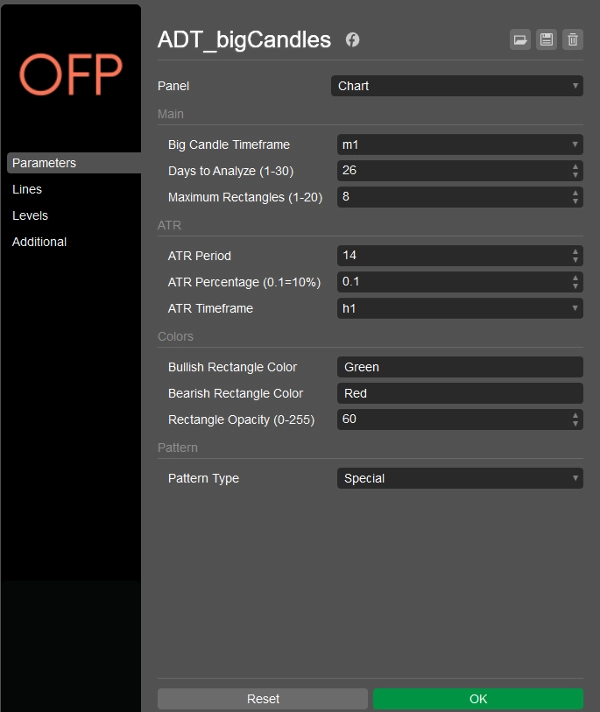
Oznacza każdą dużą świecę kolorowym prostokątem (byczym lub niedźwiedzim), który pozostaje na wykresie jako odniesienie – idealne do mapowania stref podaży/popytu oraz wsparcia/oporu. - Konfigurowalne ustawienia:
Dostosuj ramę czasową, liczbę dni do skanowania, okres ATR, wygląd prostokątów i inne. - Zarządzanie nakładaniem się:
Zapobiega nakładaniu się prostokątów tego samego typu dla przejrzystości wykresu. - Oznaczanie wzorów:
Każda strefa jest oznaczona kierunkiem, typem wzoru oraz liczbą dni od wystąpienia.
Jak to działa
- Skanuje ostatnie świece (do 30 dni wstecz) na wybranej ramie czasowej.
- Oblicza ATR, aby ustawić dynamiczny próg zakresu.
- Wykrywa i klasyfikuje największe świece według zakresu.
- Rysuje i oznacza prostokąty dla szybkiej analizy.
Dla kogo to jest?
- Traderzy prop firm i detaliczni mapujący ruchy instytucjonalne
- Traderzy price action i analizy technicznej
- Każdy, kto automatyzuje identyfikację świec i stref o dużym wpływie
O autorze:
Profesjonalny trader prop firm w The5%ers i OFP, z bogatym doświadczeniem w price action i handlu strefami. Ten wskaźnik został opracowany na podstawie rzeczywistych potrzeb tradingowych i jest codziennie używany w środowiskach handlu na żywo.
Idealny dla traderów, którzy chcą zautomatyzować wykrywanie stref i ulepszyć swoją analizę price action.
Podsumowanie
Key features include two detection modes: Standard Mode, which finds all candles exceeding the ATR threshold, and Special Mode, which filters classic price action patterns such as Outside Bars, Engulfing Candles, Doji, Marubozu, Hammer, Shooting Star, Pin Bars, and Spinning Top, with automatic labeling. The indicator prevents overlapping rectangles of the same type for chart clarity and allows customization of timeframe, ATR period, scan duration, and rectangle appearance. Each highlighted zone is labeled with candle direction, pattern type, and age.
This tool is suitable for prop firm and retail traders focused on price action and technical analysis, particularly those automating the identification of high-impact candles and zones for enhanced trading decisions.
Opinie klientów
5 | 100 % | |
4 | 0 % | |
3 | 0 % | |
2 | 0 % | |
1 | 0 % |
![Logo „Gaussian Channel [Iridio Capital]”](https://cdn.ctrader.com/image/webp/7c039209-5573-4a54-a072-f9528b503103_41960)


![Logo „[Stellar Strategies] MARSI Signal Plotter”](https://cdn.ctrader.com/image/webp/7b2b8da6-8f8e-4646-8d4a-4710c516c01e_25567)

