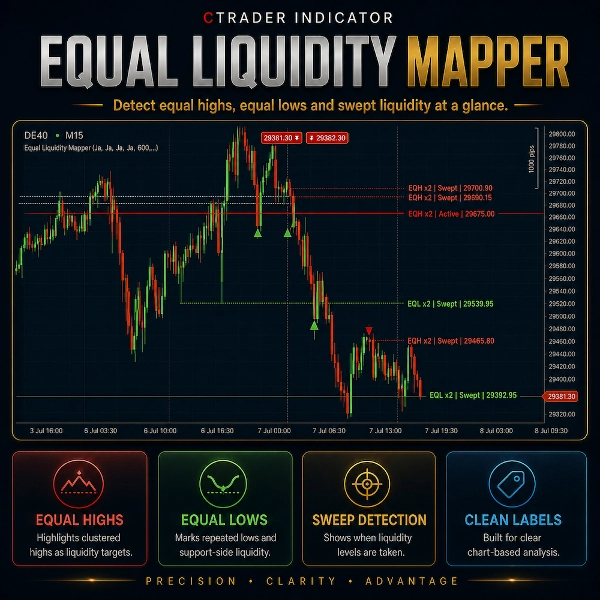
Equal Liquidity Mapper
Wskaźnik
Wersja 1.0, Jul 2026
Windows, Mac
Trading product for Equal Liquidity Mapper Wskaźnik Key Levels MSS, image 2
Trading product for Equal Liquidity Mapper Wskaźnik Key Levels MSS, image 3
Trading product for Equal Liquidity Mapper Wskaźnik Key Levels MSS, image 4
Trading product for Equal Liquidity Mapper Wskaźnik Key Levels MSS, image 5

Opis

Equal Liquidity Mapper to wizualny wskaźnik cTrader zaprojektowany do identyfikacji równych szczytów, równych dołków oraz potencjalnych pul płynności bezpośrednio na wykresie.


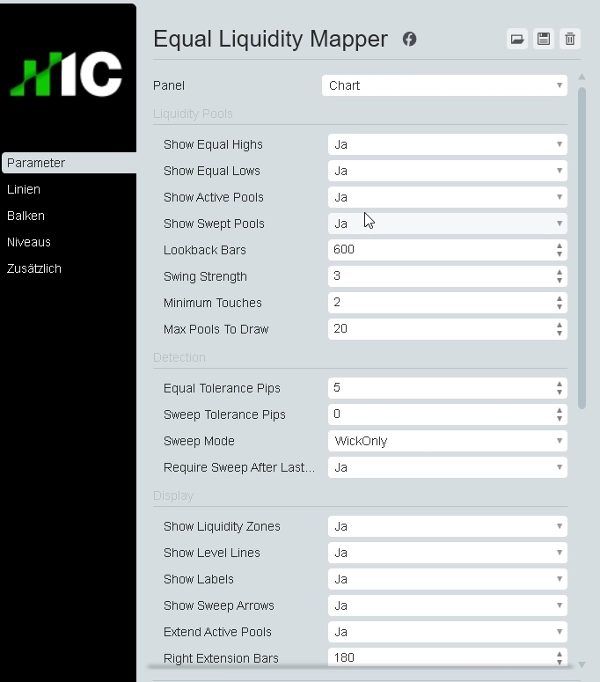
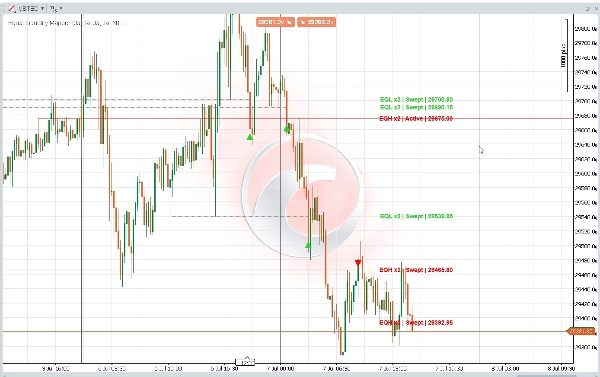
Wskaźnik skanuje lokalne maksima i minima, grupuje pobliskie poziomy w ramach konfigurowalnej tolerancji i wyświetla aktywne obszary płynności jako czyste poziome strefy i linie poziome. Może również wykrywać, czy pula płynności została już wyczyszczona, oraz opcjonalnie pokazywać wyczyszczone poziomy i strzałki wskazujące czyszczenie.


Equal Liquidity Mapper jest przydatny do analizy price action, przeglądu wykresów opartego na płynności, badania struktury rynku oraz przygotowań do testów historycznych.


Główne cechy:

- Wykrywanie równych szczytów

- Wykrywanie równych dołków

- Wizualizacja aktywnych pul płynności

- Opcjonalne wyświetlanie wyczyszczonych pul

- Markery strzałek czyszczenia

- Regulowana siła lokalnych ekstremów

- Regulowany zakres retrospektywny

- Konfigurowalna tolerancja równych poziomów

- Konfigurowalne wykrywanie czyszczenia

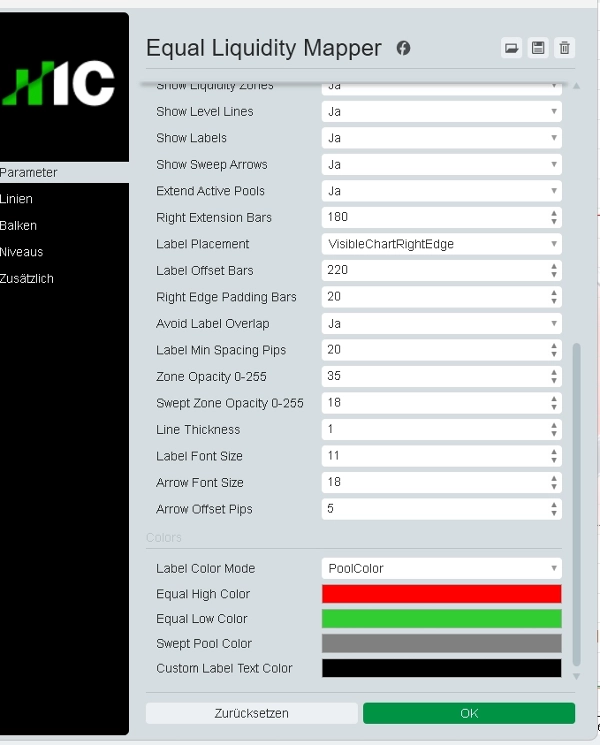
- Umieszczenie etykiet na prawej krawędzi

- Ochrona przed nakładaniem się etykiet

- Niestandardowe kolory, przezroczystość i ustawienia linii

- Czysta nakładka na wykres

- Wskaźnik bezpieczny dla sklepu z ograniczonymi prawami dostępu


Equal Liquidity Mapper nie jest robotem handlowym. Nie wykonuje transakcji, nie modyfikuje zleceń ani nie zapewnia gwarantowanych sygnałów kupna/sprzedaży. Jest to wyłącznie narzędzie do wizualnej analizy i kontekstu rynkowego.


Handel wiąże się z ryzykiem. Ten wskaźnik nie udziela porad finansowych, rekomendacji inwestycyjnych, statystycznych prawdopodobieństw ani gwarantowanych wyników handlowych.

Podsumowanie

Podsumowanie AI
Equal Liquidity Mapper is a visual indicator for the cTrader platform that identifies and maps equal highs, equal lows, and active liquidity pools directly on price charts. It analyzes swing highs and lows, groups nearby levels within a user-configurable tolerance, and displays these as horizontal zones and lines to highlight potential liquidity areas. The indicator can detect whether liquidity pools have been swept and optionally marks these with arrows and labels.
Key features include adjustable swing strength and lookback range, configurable equal-level tolerance and sweep detection, label overlap protection, and customizable colors and opacity. The indicator provides a clean chart overlay designed for price action analysis, liquidity-based chart review, market structure research, and backtesting preparation.
Equal Liquidity Mapper does not execute trades or provide trading signals; it serves solely as a market context and visual analysis tool. It supports visualization of key market structure concepts such as liquidity grabs, market structure shifts, and key levels. The indicator operates on bar data and supports signals like divergence, reversal, level breaks, and session open range.

Profil wskaźnika
Kategoria wskaźnika
Struktura rynku (SMC)
Typ wyjścia
Wizualizacja
Wymagania dotyczące danych
Tylko słupki
Obsługiwane sygnały
Dywergencja
Odwrócenie trendu
Przebicie poziomu
Zakres otwarcia sesji

Opinie klientów

0.0
Opinie: 0
Opinie klientów
Ten produkt nie ma jeszcze opinii. Wypróbowałeś(-aś) go już? Bądź pierwszy(-a) i powiedz o tym innym!

Dyskusja

Częste pytania

Key Levels
MSS
Market Structure
Liquidity Grab
Produkty dostępne za pośrednictwem cTrader Store, w tym boty handlowe, wskaźniki i wtyczki, dostarczane są przez deweloperów zewnętrznych i udostępniane wyłącznie w celach informacyjnych oraz w celu zapewnienia dostępu technicznego. cTrader Store nie jest brokerem i nie zapewnia doradztwa inwestycyjnego, nie udziela spersonalizowanych rekomendacji ani nie gwarantuje przyszłych wyników.

Więcej od tego autora

Wskaźnik
SMC
Prop
+6
Automatically draws the Opening Range (High & Low) for Tokyo, London, and New York sessions. Configurable start times,
Wskaźnik
BOS
Key Levels
+2
Maps bullish and bearish order block zones, CE levels and structure-based price action context.
Wskaźnik
Liquidity Grab
Liquidity Sweep
+2
Visualizes accumulation ranges, manipulation sweeps and distribution phases on your cTrader chart.
Wskaźnik
MSS
Key Levels
+4
Maps session ranges, previous highs/lows, equilibrium and premium/discount zones on your cTrader chart.
Wskaźnik
Key Levels
Liquidity Grab
+3
Visual market context dashboard showing bias states, CE positioning, session status and sweep context.
Wskaźnik
BOS
MSS
+3
Maps BOS, CHoCH, swing breaks and market structure shifts directly on your cTrader chart.
Wskaźnik
EMA
RSI
+2
Compact premium cTrader dashboard for market bias, sessions, premium/discount context, liquidity direction, ADR range an
Wskaźnik
SMC
Prop
+12
Killzone, ICT, SMC, Session, Asia, London, New York, NY PM, Session High, Session Low, Smart Money, Order Flow, Trading
Wskaźnik
SMC
Prop
+12
Shows bullish/bearish bias for 5 timeframes in one panel. Three bias methods, alignment summary, fully configurable.

Możesz także polubić

Wskaźnik
📊 Smart Floating Risk Pro – Advanced Risk Management for cTrader
Wskaźnik
Forex
BTCUSD
+6
Multi-pole Gaussian filter channel with dynamic color, Reduced Lag & Fast Response modes. Port of DonovanWall's original
Wskaźnik
Displays the previous day's, last week's, and last month's highest and lowest price levels on your chart.
Wskaźnik
Prop
Forex
+4
This is an indicator that can alert you about trendlines, horizontal lines and vertical lines.
Wskaźnik
News Filter
External Data
+3
Real-time financial news and economic calendar overlay for cTrader with smart alerts
Wskaźnik
Prop
Forex
+9
Average Cost Price helps you keep track of your open positions on the chart. In doing so, it provides lines and explanat
Wskaźnik
Prop
Forex
+4
Universal multi time frame 'Moving Average' indicator with extended features
Wskaźnik
ATR
MACD
+15
MACD Advanced -- It combines the standard MACD logic with a rich set of visual tools
Wskaźnik
SMC
Prop
+13
Perfect for traders who demand a clear overview of multiple timeframes at a glance.
Wskaźnik
BOS
CHOCH
+2
The full SMC suite: structure BOS CHoCH MSS , FVG, liquidity, order blocks & a 0 to100 confluence score. No repaint.
Wskaźnik
Overlay HTF context on any chart: color bars by HTF and draw filled HTF bodies with optional High/Low lines.
Wskaźnik
CHOCH
Key Levels
+5
ZigZag Market Structure Identifier - Multi-Layer Scanner: Convergent Pivot Detection, 4-TF Overlay & Naked Chart Mode.
Wskaźnik
VWAP
Volume
+2
VWAP Stdev Heatmap: Advanced daily VWAP with 5-tier standard deviation bands and dynamic candlestick coloring.
Wskaźnik
MCDX is a powerful and innovative indicator.
Wskaźnik
ATR
BOS
+3
Fair Value Gaps with Multi-Timeframe.
Wskaźnik
Forex
Multi-timeframe candlesticks!
Wskaźnik
Auto Fibonacci Retracement Indicator for cTrader
Wskaźnik
Prop
Forex
NEW - PNLs as % - daily, weekly, monthly, or yearly & Spread, Time To Close, PNL Alerts, custom Bid / Ask lines

Cena