present
Sign up and get $50 off your first purchase
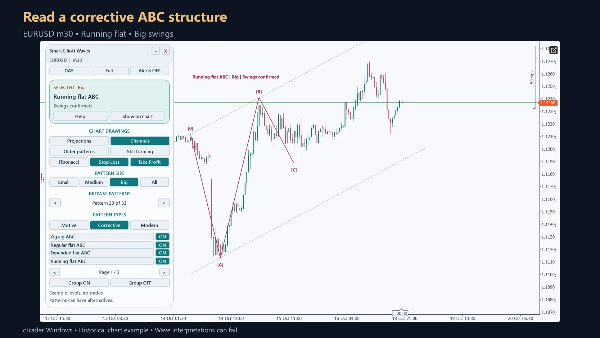
Trading product for Smart Elliott Waves Indicator Fibonacci Key Levels, image 1
Smart Elliott Waves
Indicator
Version 1.1, Oct 2026
Windows, Mac
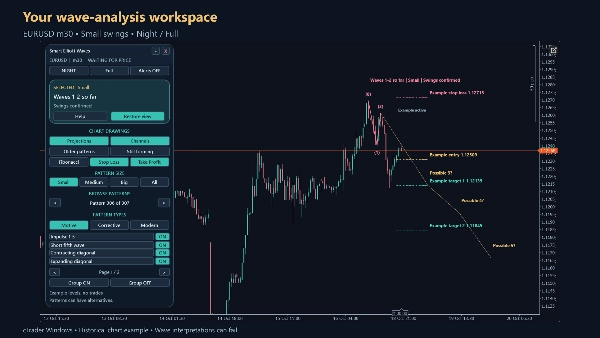
Trading product for Smart Elliott Waves Indicator Fibonacci Key Levels, image 2
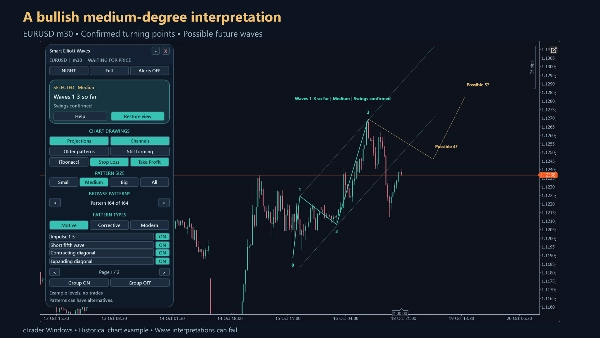
Trading product for Smart Elliott Waves Indicator Fibonacci Key Levels, image 3
Trading product for Smart Elliott Waves Indicator Fibonacci Key Levels, image 4
Since 16/10/2026

Description

Smart Elliott Waves


Smart Elliott Waves is a chart-pattern indicator for cTrader Windows. It helps you examine possible Elliott wave counts, compare swing sizes and review reference levels in the context of real price history. It supports manual analysis; it does not open or manage trades.


READ THE STRUCTURE

Explore 22 pattern families across Motive, Corrective and Modern groups. Small, Medium and Big use different swing depths; All shows the combined selection. Browse alternative counts and distinguish confirmed swing points from a last swing that is still forming. Confirmation of the swing points does not guarantee that a wave interpretation will succeed.


CONTROL THE CHART

Use the draggable panel to show or hide projections, channels, Fibonacci retracements and older patterns. Filter individual pattern families or a whole group. Choose Day or Night colours and Full, Standard or Compact layouts. The panel adapts to available chart space, remembers settings when enabled, and includes 21 help pages.


REVIEW EXAMPLE LEVELS

Eligible confirmed patterns may display a hypothetical entry, stop and two targets. The indicator records target, stop, expiry and ambiguous touch states. These are analytical examples based on candle data, not broker executions or profit records. If a stop and target are touched within one candle, their sequence cannot be determined from that candle alone.


PRACTICAL USE

Start on a liquid forex instrument with a readable candle history, for example EURUSD h1. Compare Small, Medium and Big, then browse counts to understand alternative interpretations. Use historical examples to learn the controls before relying on any analysis. Data availability, instrument precision, history length and settings affect the result. No instrument or period is guaranteed to be profitable.


ALERTS AND OUTPUTS

Optional desktop popup and email alerts report newly confirmed patterns after initialization. Alerts are off by default. Email requires a working cTrader email configuration and sender/recipient settings. Eight outputs expose the latest analytical plan: direction, entry, stop, target 1, target 2, known time, setup ID and status. Automation mode provides calculation access without the visual panel; it does not execute orders.


IMPORTANT LIMITS

Elliott interpretations can overlap and disagree. A forming final swing can move. Confirmed counts become available only after later price information confirms the swing. Projected waves are scenarios, not forecasts. Modern patterns use explicit experimental shape rules. Smaller-wave evidence is bounded; it does not verify the count's position in a larger Elliott structure. A waiting or offline status is not a new market signal.


Trading involves risk. Past performance does not guarantee future results.


Summary

Indicator profile
Indicator category
Pattern
Output type
Visualisation
Signals
Data requirements
Bars only

Discussion

Customer reviews

0.0
Reviews: 0
Customer reviews
No reviews for this product yet. Already tried it? Be the first to tell others!

FAQ

Fibonacci
Key Levels
Market Structure
Products available through cTrader Store, including trading bots, indicators and plugins, are provided by third-party developers and made available for informational and technical access purposes only. cTrader Store is not a broker and does not provide investment advice, personal recommendations or any guarantee of future performance.

More from this author
Indicator
RSI
VWAP
+5
Trend direction, chart signals, reversal zones and volume tools in one configurable indicator.
Indicator
Volume
Order Block
+3
Map market structure, order blocks, liquidity and key zones with an interactive cTrader dashboard.
Indicator
Key Levels
Trend-filtered signals, transparent trade plans and a multi-timeframe decision panel for cTrader.
Indicator
Volume
Key Levels
+1
Six timeframe decisions, chart trade plans and historical risk simulation in one interactive cTrader indicator.
Indicator
Volume
Support & Resistance
Compare up to 27 symbols across eight timeframes with seven analysis engines and an interactive cTrader dashboard.
Indicator
ATR
Key Levels
+1
Explore 88 harmonic price-pattern variants with interactive chart controls and geometric reference levels.

You may also like

Indicator
Smart Signal Reversal Trend + Patterns
Indicator
Prop
Forex
+4
TSPivotSMC-V2: The Fusion of Classical Pivots & Institutional Liquidity.
Indicator
VWAP
Forex
+5
Trade with institutional accuracy. Identify fair price levels and high-volume zones instantly!
Indicator
Forex
Identify 34 candlestick patterns, track trends across timeframes, and get instant alerts with this powerful trading tool
Indicator
Prop
Forex
+11
⚡Nebula Range Filter is a professional trend filter indicator for cTrader⚡
Indicator
Forex
EURUSD
+5
The Smart Money Concepts indicator is an all-in-one overlay tool that automatically detects OB, FVG ecc..
Indicator
RSI
VWAP
+3
Asia, London & NY sessions mapped in real time, boxes, VWAP, kill zones, range extensions, and a built-in RSI panel.
Indicator
Area of Interest with the power of AI to detect the market interest.
Indicator
Risk Dashboard
AI-powered daily range forecasts help traders spot volatility opportunities and plan stops and targets.
Indicator
ATR
Wedge
+2
Strong Supertrend Turn Market Movement into a Clear Map Market analysis
Indicator
SMC
Forex
+15
Smart institutional order block & FVG scanner with alerts, zone merging, and HTF confluence.
Indicator
AI
SMC
+19
Fixed Range Volume Profile - TradingView Style (POC, VAH, VAL)
Indicator
Volume
Order Block
+3
Map market structure, order blocks, liquidity and key zones with an interactive cTrader dashboard.
Indicator
Forex
Crypto
+3
Enhance Pitchfork & Price Channels in cTrader with customizable Equidistant and Fibonacci levels.
Indicator
Volume
Imbalance
+5
Professional OrderFlow Footprint Analysis ( Bid/ask, POC, VA, Delta, Absorption, Imbalance )
Indicator
RSI
VWAP
+5
Trend direction, chart signals, reversal zones and volume tools in one configurable indicator.
Indicator
EMA
RSI
+5
MACD Colour Histogram with 11 Moving Average Types, Multi-timeframe confirmation and Sound Signal Alert.
Indicator
Supertrend
Moving Average
Easy Trade: Trend & Breakout Indicator for cTrader

Price

Since 16/10/2026