
Opis
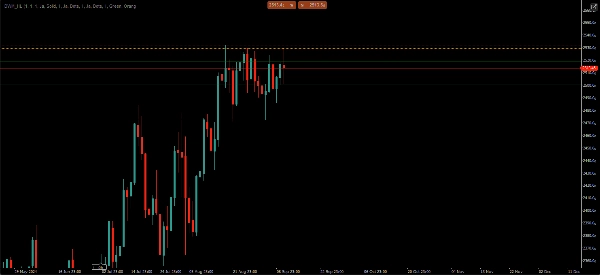
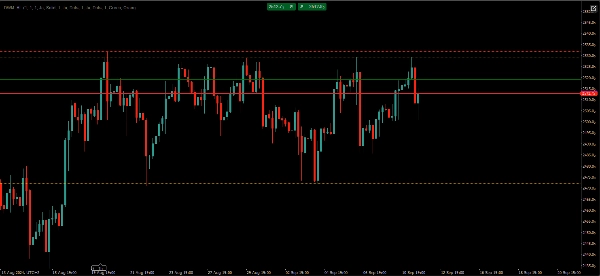
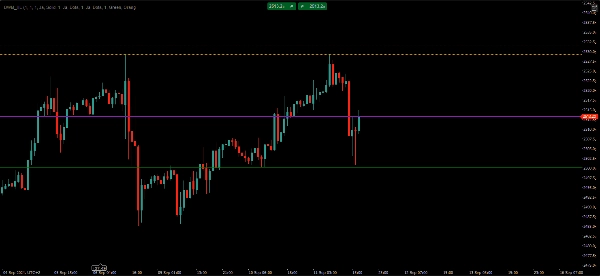
Poziomy płynności NGS – dzienne • tygodniowe • miesięczne maksima i minima
Handluj wokół płynności, nie wokół losowych linii.
Poziomy płynności NGS automatycznie wyświetlają najważniejsze dzienne, tygodniowe i miesięczne poziomy płynności na każdym wykresie.
• Brak ręcznego rysowania
• Brak zmiany interwału czasowego
• Brak zagracenia wykresu
Ten przyjazny dla użytkownika wskaźnik pomaga traderom w ciągu sekund zidentyfikować kluczowe poziomy płynności i struktury rynku. Zamiast codziennie ręcznie zaznaczać maksima i minima, najważniejsze poziomy są automatycznie wyświetlane i aktualizowane dla Ciebie.
Funkcje:
• Automatyczne dzienne poziomy maksymalne i minimalne
• Automatyczne tygodniowe poziomy maksymalne i minimalne
• Automatyczne miesięczne poziomy maksymalne i minimalne
• Opcjonalne poziomy z poprzedniego okresu
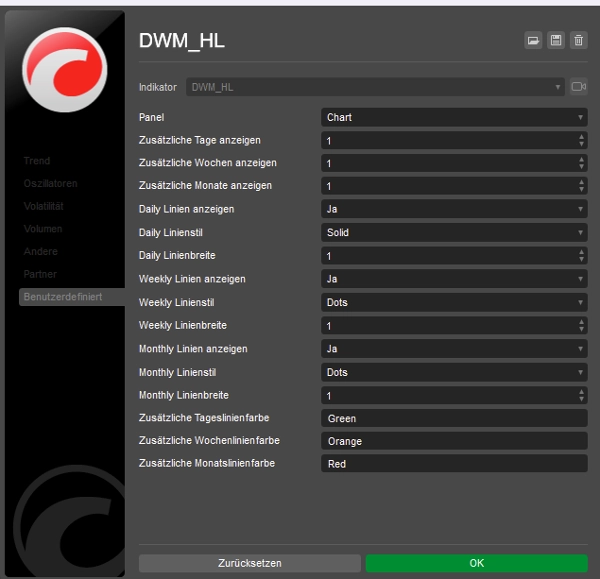
• Konfigurowalne kolory i style linii
• Czysty i lekki wyświetlacz wykresu
• Działa na rynku Forex, indeksach, surowcach i kryptowalutach
• Obsługuje wiele interwałów czasowych
• Nie przemalowuje się
Stworzony dla traderów skupiających się na strukturze rynku, płynności i poziomach wyższych interwałów czasowych.
Brak sygnałów.
Brak strategii.
Brak obietnic zysku.
Tylko obiektywne poziomy płynności i czystszy proces handlu.
Podsumowanie
Opinie klientów
5 | 100 % | |
4 | 0 % | |
3 | 0 % | |
2 | 0 % | |
1 | 0 % |


