

Money Flow Profile
Wskaźnik
Wersja 1.0, Jul 2026
Windows, Mac

534.4M
Wolumen transakcji
9.76M
Zysk w pipsach
4
Sprzedaż
Opis
📊 Profil Przepływu Pieniędzy
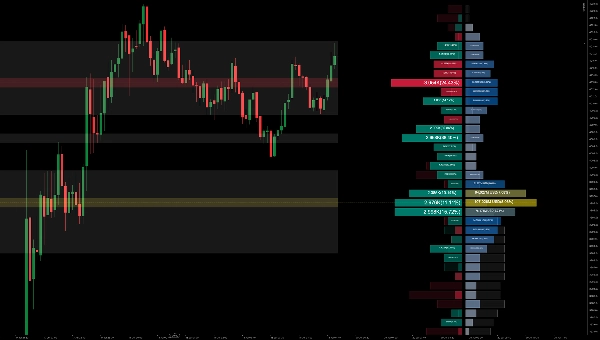
Profil Przepływu Pieniędzy to zaawansowane narzędzie wykresowe mierzące obrót lub przepływ pieniędzy na wszystkich poziomach cenowych na rynku w określonym okresie czasu. Podkreśla związek między ceną aktywa a gotowością traderów do kupna lub sprzedaży, pozwalając na:
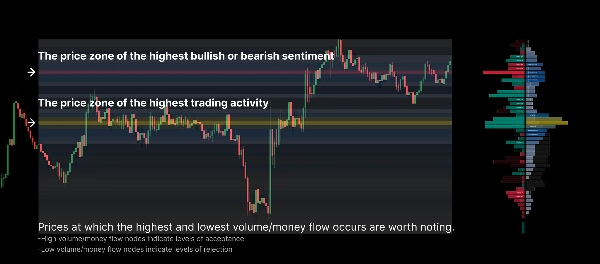
- Odkrywanie Kluczowych Poziomów Cenowych: Łatwe identyfikowanie skupisk wolumenu i węzłów o wysokiej płynności, takich jak Punkt Kontroli (POC).
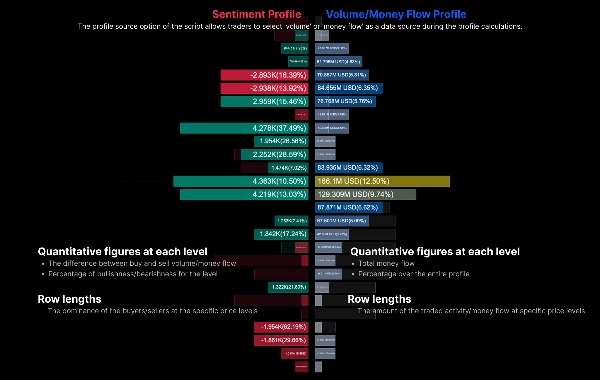
- Analiza Nastrojów Rynkowych: Poprzez wyświetlanie Profilu Nastrojów po lewej i Profilu Wolumenu po prawej, określa, czy kupujący czy sprzedający dominują na każdym konkretnym poziomie cenowym.
- Porównanie Międzyokresowe: Bezpośrednie porównanie bieżącego profilu z profilem duchowym z poprzedniego okresu, aby zaobserwować przesunięcia środka ciężkości rynku.
⚙️ Podstawowe Parametry i Przewodnik Użytkowania
1. Ustawienia Ogólne
- Długość Okna / Stały Zakres: Definiuje liczbę historycznych świec używanych do obliczenia profilu (np. ostatnie 200 świec).
- Źródło Danych:
-
1 = Wolumen: Oblicza profil na podstawie tradycyjnego wolumenu tick/trading.2 = Przepływ Pieniędzy: Uwzględnia głębokość cenową do obliczenia rozkładu przepływu pieniędzy.
2. Ustawienia Profilu
- Rozdzielczość Wierszy (Wiersze): Określa szczegółowość osi pionowej. Wyższa liczba (np. 50-100) skutkuje bardziej szczegółowym profilem.
- Szerokość Profilu i Przesunięcie Poziome: Dostosowuje szerokość rysowanego profilu (w procentach) oraz przesunięcie w prawo, zapobiegając nakładaniu się na bieżącą świecę.
3. Nastrój i Wyświetlanie
- Polaryzacja Nastroju:
-
1 = Świeca: Określa byczy/niedźwiedzi nastrój wyłącznie na podstawie otwarcia i zamknięcia świecy (polaryzacja).2 = Presja Kupna/Sprzedaży: Używa dokładniejszego obliczenia uwzględniającego knoty i zamknięcie względem maksimum/minimum.
- Pokaż Profil Nastroju / Profil Wolumenu: Niezależne przełączniki do wyświetlania netto profilu nastroju (lewy) i głównego profilu wolumenu (prawy).
- Pokaż Poprzedni Okres: Po włączeniu rysuje tło w postaci "Duchowego Słupka" reprezentującego dokładnie ten sam przedział czasowy z poprzedniego okresu. Świetne do śledzenia przesunięć wsparć/oporów.
4. Rozszerzone Wyświetlanie Obszaru
- Pokaż Mapę Ciepła: Projekcja gęstości profilu na cały okres obliczeniowy jako tło w formie mapy ciepła. Możesz wybrać projekcję "Wolumen" lub "Nastrój".
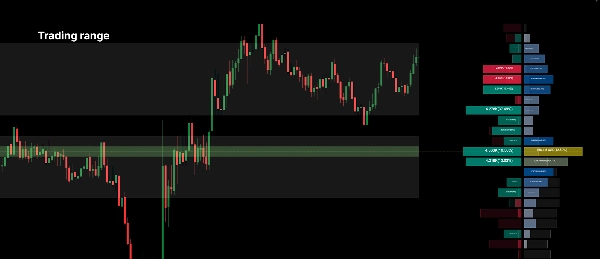
- Pokaż Obszar Wartości: Podkreśla główny zakres cenowy, w którym miała miejsce większość obrotu. Próg jest konfigurowalny (np. 70%).
- Pokaż Strefę POC: Automatycznie rysuje linię poziomą i strefę na Poziomie Kontroli (cena z najwyższym wolumenem) dla wybranego zakresu.
💡 Praktyczne Wskazówki Handlowe:
- Szukaj Węzłów o Wysokim Wolumenie (Szczyty) jako silnych poziomów wsparcia lub oporu.
- Szukaj Węzłów o Niskim Wolumenie (Dolina), ponieważ cena ma tendencję do szybkiego przemieszczania się przez te strefy o niskiej płynności.
- Używaj Duchowego Profilu z Poprzedniego Okresu: Jeśli bieżący POC (żółta linia) formuje się wyżej niż POC z poprzedniego okresu, wskazuje to na przesunięcie konsensusu wartości w górę, co jest zazwyczaj sygnałem byczym.
Podsumowanie
AI summary
Money Flow Profile is an advanced indicator that maps traded volume and market sentiment across price levels over a specified time period. It visualizes the relationship between price and trader activity, highlighting key liquidity zones such as volume clusters and the Point of Control (POC). The tool displays a Sentiment Profile on the left and a Volume Profile on the right, enabling users to assess whether buyers or sellers dominate at each price level. It supports direct comparison with the previous period’s profile via a ghost overlay to track shifts in market value consensus.
Core configurable parameters include lookback length, data source selection (volume or money flow), row resolution for vertical granularity, profile width and offset, and sentiment polarity calculation methods (candle-based or buy/sell pressure). Display options allow toggling of sentiment and volume profiles, previous period overlays, heatmaps of volume or sentiment density, value area highlighting, and automatic POC zone marking.
The indicator is designed to help identify strong support and resistance levels at high volume nodes and anticipate rapid price movements through low volume nodes. It supports detailed volume and sentiment analysis to inform trading decisions based on liquidity and market structure.
Core configurable parameters include lookback length, data source selection (volume or money flow), row resolution for vertical granularity, profile width and offset, and sentiment polarity calculation methods (candle-based or buy/sell pressure). Display options allow toggling of sentiment and volume profiles, previous period overlays, heatmaps of volume or sentiment density, value area highlighting, and automatic POC zone marking.
The indicator is designed to help identify strong support and resistance levels at high volume nodes and anticipate rapid price movements through low volume nodes. It supports detailed volume and sentiment analysis to inform trading decisions based on liquidity and market structure.
Profil wskaźnika
Kategoria wskaźnika
Wolumen
Typ wyjścia
Wizualizacja
Wymagania dotyczące danych
Wolumen
GłR
Tylko słupki
Dane tickowe
Obsługiwane sygnały
Przełamanie
Siła trendu
Odwrócenie trendu
Zmienność
Dotknięcie poziomu
Przebicie poziomu
Opinie klientów
0.0
Opinie: 0
Opinie klientów
Ten produkt nie ma jeszcze opinii. Wypróbowałeś(-aś) go już? Bądź pierwszy(-a) i powiedz o tym innym!
Dyskusja
Częste pytania
Key Levels
Volume
Produkty dostępne za pośrednictwem cTrader Store, w tym boty handlowe, wskaźniki i wtyczki, dostarczane są przez deweloperów zewnętrznych i udostępniane wyłącznie w celach informacyjnych oraz w celu zapewnienia dostępu technicznego. cTrader Store nie jest brokerem i nie zapewnia doradztwa inwestycyjnego, nie udziela spersonalizowanych rekomendacji ani nie gwarantuje przyszłych wyników.
Więcej od tego autora




















Cena
534.4M
Wolumen transakcji
9.76M
Zysk w pipsach
4
Sprzedaż