Description
FOOTPRINT PRO — BID x ASK CLUSTER CHART
Candles tell you where price moved. A footprint tells you who moved it. Footprint Pro breaks every candle open into price clusters built from real tick data, showing exactly where buyers and sellers fought — and who won.
This is the kind of order flow analysis that normally requires a dedicated platform and a monthly subscription. Footprint Pro brings it natively into cTrader, as a one-time purchase.
🆕 NEW IN VERSION 2
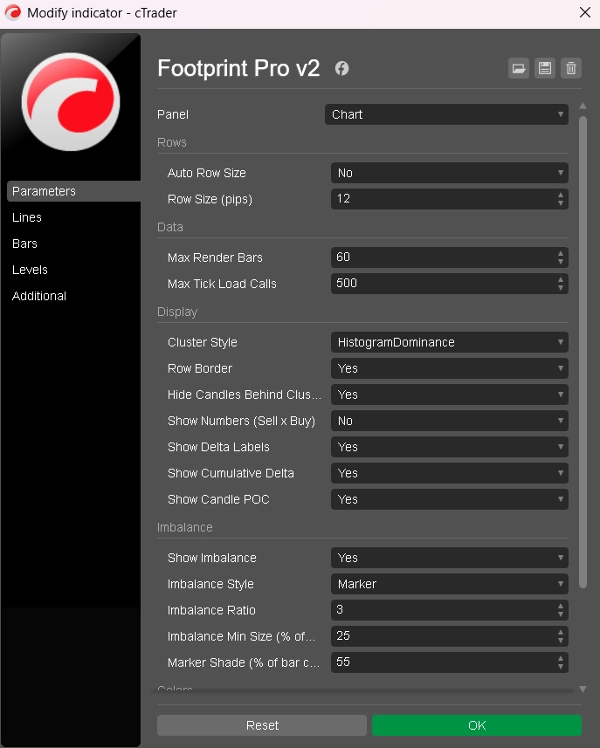
• Histogram clusters — every row is now drawn as a bar whose length carries its volume, so the busiest rows stand out without decoding shades of colour. Choose a single dominance colour, a buy/sell split, or keep the original heatmap.
• Row borders in a colour of your choice. Set them to your chart background and the rows separate into crisp, evenly spaced bars.
• Cleaner imbalance — markers now sit in the margin beside the row instead of framing it, with an on/off switch, a minimum size filter so only rows that carry weight are marked, and a shade that never blends into the bar next to it.
• Uniform cluster width — a session gap could previously stretch one cluster wide enough to overlap its neighbours. Every candle now gets the same width.
• Fresh defaults for a cleaner first look: fixed 10 pip rows, dominance style, numbers off. Your existing settings are untouched.
🔍 WHAT YOU SEE ON EVERY CANDLE
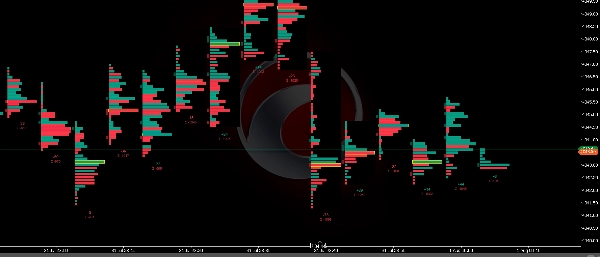
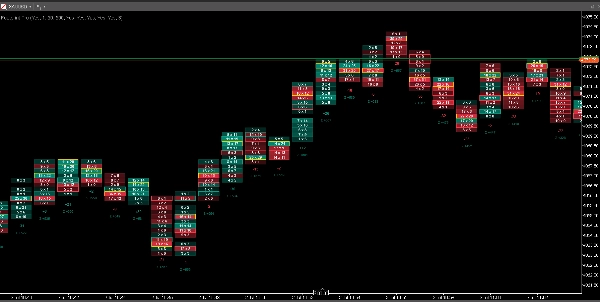
• Volume clusters — each candle is split into price rows, and every row is drawn as a bar whose length carries its traded volume. The busiest row is obvious at a glance, no colour decoding required.
• Three cluster styles — dominance (one colour per row, the cleanest read), buy/sell split (each bar divided into selling and buying volume), or heatmap (full width, intensity by activity).
• Sell x Buy numbers — zoom in and every row can display its exact sell and buy tick counts, classified by real uptick/downtick movement.
• Candle POC — the busiest price row of each candle, outlined in gold.
• Delta — net buying vs selling per candle, printed under each bar.
• Cumulative delta — running session delta (Σ) under every candle, resetting daily. Spot divergences: price making highs while Σ falls is a warning no candle chart can give you.
• Imbalance markers — where aggression overwhelms the opposite side diagonally, a marker appears in the margin beside the row. Markers sit outside the bars in their own column, so the cluster stays clean, and stacked markers are easy to spot — they often mark institutional activity.
⚡ BUILT FROM REAL TICK DATA
• Every cluster is constructed from your broker's actual tick history — not bar approximations.
• Smart lazy loading: only visible candles are processed, in the background, so your chart never freezes.
• Live updates: the current candle's clusters, delta and Σ update tick by tick as trading happens.
• Deep history: when you scroll beyond your broker's tick data, Footprint Pro automatically switches to M1-based approximation and marks those bars with ≈ — no blank charts, no surprises.
🎯 HOW TRADERS USE IT
• Confirm breakouts: strong delta and stacked imbalances in the breakout candle separate real moves from traps.
• Fade exhaustion: high volume with shrinking delta at a swing high/low signals absorption.
• Read divergence: price up + cumulative delta down = rally without real buying.
• Refine entries: enter at the candle POC or imbalance levels instead of arbitrary prices.
⚙️ FULLY ADJUSTABLE
• Fixed row size in pips, or automatic sizing that adapts to the symbol's range.
• Row borders with your own colour — set them to your chart background and the rows separate into crisp, evenly spaced bars.
• Imbalance controls: on/off, marker or outline, ratio, and a minimum size filter so only rows that actually carry weight are marked.
• Toggle numbers, delta labels, cumulative delta and candle POC independently.
• Every colour customizable, plus render limit and font size.
• Candles are automatically hidden behind clusters for a clean, professional footprint look.
🧪 TRY BEFORE YOU BUY
A free trial version is available — same engine, displaying the most recent 15 candles. Test it on your broker's data first, then upgrade to the full version.
Works on any symbol. Best experienced on M1–M15 charts. One-time purchase, no subscription, free updates.
Summary
The indicator updates live with tick-by-tick data and uses smart lazy loading to maintain chart performance. When tick data is unavailable, it switches to an approximate mode based on 1-minute bars, clearly marking these bars. Footprint Pro supports full customization of row sizing, display options (numbers, delta labels, POC, imbalances), color schemes, and imbalance sensitivity.
Traders use Footprint Pro to confirm breakouts, detect exhaustion and absorption, identify divergences between price and volume, and refine entry points based on volume clusters rather than arbitrary prices. It works on any symbol, is optimized for 1- to 15-minute charts, and is available as a one-time purchase with free updates. A free trial version displays the most recent 15 candles for evaluation.