
Description
SR COMMANDER — Multi Timeframe Edition
See where the big money draws the line. Trade on your timeframe. Think on theirs.
Most support and resistance tools are chained to your chart timeframe. If you're scalping on M1, your S/R levels come from M1 candles — small, noisy, and easily faked. SR Commander MTF breaks that chain.
Set your chart to M1. Set your SR timeframe to H1. Now you're scalping with the precision of a one-minute chart, but your support and resistance levels are drawn from the hourly candles where institutions, algorithms, and professional traders actually make their decisions. That's the edge.
HOW THE MULTI TIMEFRAME ENGINE WORKS
The indicator runs two independent data streams simultaneously.
Your chart timeframe controls what you see — your candles, your entries, your arrows, your timing. Your SR timeframe controls where the levels come from. These two streams are mapped to each other in real time, bar by bar. When a new chart candle closes, SR Commander looks up the correct SR timeframe candle for that exact moment and recalculates the levels from that higher timeframe's structure.
This means your green support line and red resistance line always reflect the volatility-weighted structure of the SR timeframe you selected — not the noise of the chart you're watching.
THE SCIENCE BEHIND THE LEVELS
SR Commander doesn't just draw lines at swing highs and lows. It uses a Yang-Zhang volatility model — the same class of volatility estimator used in professional quantitative research — to calculate the true statistical weight of each candle. Every level is derived from normalized price structure, accounting for overnight gaps, open-to-close movement, and intrabar range. The result is levels that carry real mathematical significance, not just visual prominence.
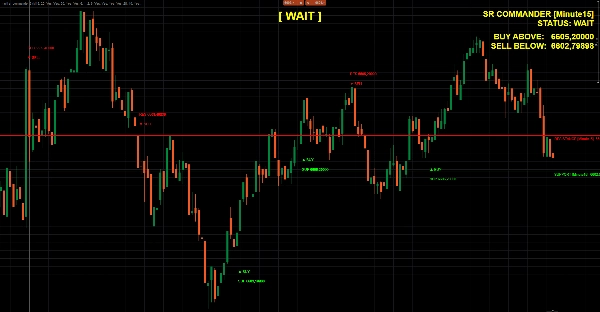
WHAT YOU SEE ON THE CHART
- 🟢 Green support line — the nearest statistically significant floor below current price, sourced from your chosen SR timeframe
- 🔴 Red resistance line — the nearest statistically significant ceiling above current price, sourced from your chosen SR timeframe
- ⬆️ BUY signal — fires when price bounces off support with a confirmed bullish close on the SR timeframe candle
- ⬇️ SELL signal — fires when price rejects resistance with a confirmed bearish close on the SR timeframe candle
- 📊 Live dashboard — shows active SR timeframe, current status, and exact breakout trigger prices
- 🔵 Big status label — BUY / SELL / WAIT, updated every bar at the top center of your chart
- 🕓 Historical overlay — bounces, rejections, breakouts and breakdowns marked on the chart for instant visual validation
TIMEFRAME COMBINATIONS THAT WORK
Chart TFSR TimeframeUse Case
M1
M5 or M15
Fast scalping with short-term structure
M5
H1
Intraday trading with hourly levels
M15
H4
Swing entries with 4-hour structure
H1
D1
Position trading off daily S/R
Any
Chart
Classic mode — original single-TF behavior
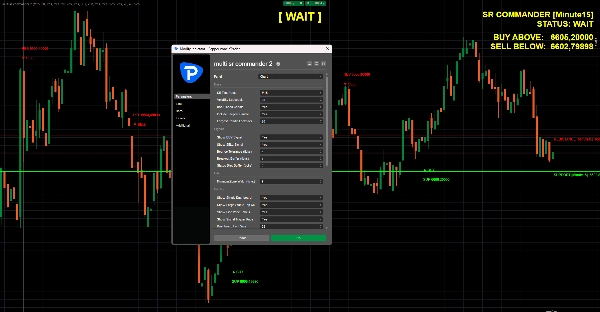
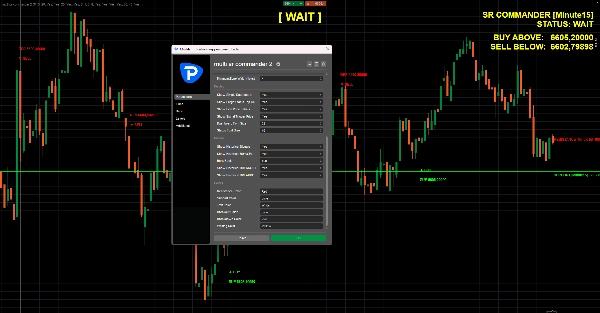
FEATURES
- Full multi timeframe engine — any SR timeframe on any chart timeframe
- Yang-Zhang volatility-normalized level calculation
- Largest candle inclusion — always captures the dominant structure candle of the lookback period
- Bounce and rejection signal logic with configurable tolerance and buffer
- Breakout and breakdown detection with adjustable buffer
- Historical signal overlay for immediate chart-based validation
- Dashboard and big status label with fully customizable font sizes and colors
- Zero repaint — all signals based on closed candles when confirmation mode is active
WHO IS THIS FOR?
Traders who understand that the best entries live on lower timeframes, but the best levels live on higher ones. If you've ever drawn H4 levels by hand while trading M5 — SR Commander automates that entire process, keeps it mathematically grounded, and puts the signal right on your chart the moment price reacts.
Higher timeframe structure. Lower timeframe precision. One indicator.
Summary
The indicator calculates S/R levels using the Yang-Zhang volatility model, which accounts for overnight gaps, open-to-close movement, and intrabar range to produce statistically significant levels rather than simple swing highs and lows. On the chart, it shows a green support line and a red resistance line representing the nearest significant levels below and above the current price from the chosen S/R timeframe.
Additional features include buy and sell signals triggered by price reactions to these levels confirmed on the S/R timeframe, a live dashboard displaying current status and breakout prices, a large status label indicating BUY, SELL, or WAIT, and historical overlays marking past bounces, rejections, and breakouts. The indicator supports various timeframe combinations suitable for scalping, intraday, swing, and position trading across markets including forex, indices, commodities, stocks, and crypto.
Customer reviews
5 | 50 % | |
4 | 50 % | |
3 | 0 % | |
2 | 0 % | |
1 | 0 % |


