


Description
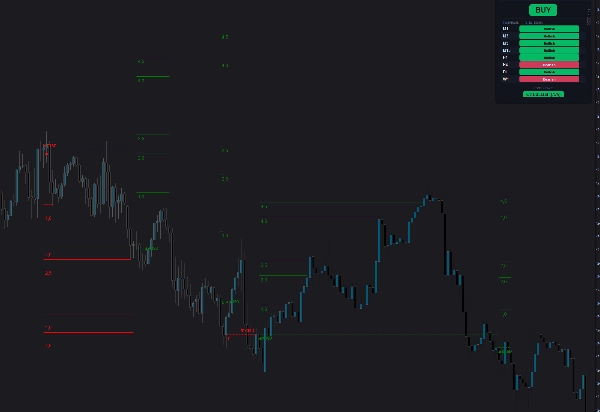
The CISD Projections Panel Indicator is an advanced trading tool for cTrader designed to detect precise market structure shifts (CISD – Change in State of Delivery) and automatically generate projection levels along with multi-timeframe confirmation.
🔍 What does the indicator do?
This indicator analyzes price action in real time to identify transitions between bullish and bearish market phases. Once a valid CISD is triggered, it automatically draws projection levels based on the previous price range, helping traders anticipate future price movements.
📊 Key Features
1. Automatic CISD Detection
- Identifies bullish and bearish CISD patterns
- Configurable bar threshold for signal validation
- Optional filter to improve signal quality
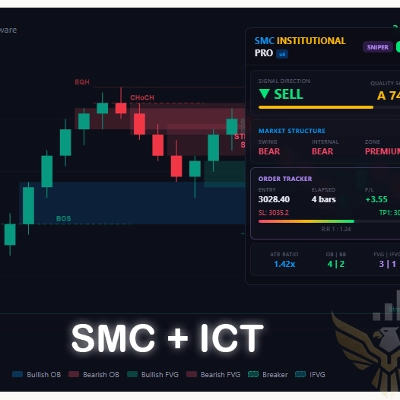
- Automatic invalidation on market structure breaks (CHoCH)
2. Projection Levels (Targets)
- Up to 5 customizable projection levels (L1–L5)
- Fully adjustable multipliers for each level
- Dynamic extension of levels as price evolves
- Visual tracking of reached targets
3. Smart Chart Visualization
- Clean and intuitive overlay directly on the chart
- Color-coded bullish and bearish zones
- Background highlighting of active ranges
- Optional CISD labels and base level display
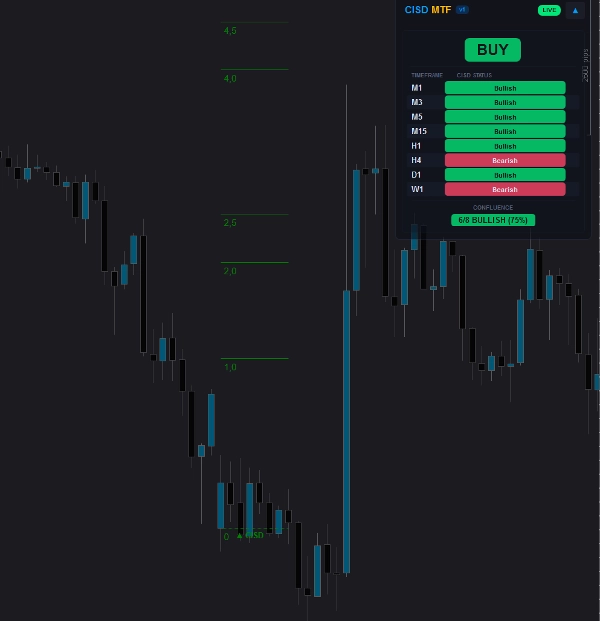
4. Multi-Timeframe (MTF) Panel
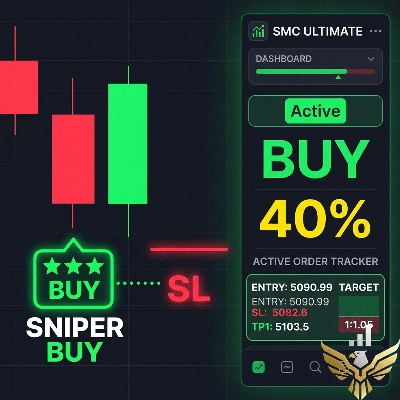
- Displays real-time bias across multiple timeframes (M1 to W1)
- Clear bullish/bearish status per timeframe
- Automatic confluence calculation
- Generates high-probability signals like:
- BUY / SELL (strong alignment)
- LEAN BULL / LEAN BEAR (moderate bias)
- MIXED / WAITING (no clear direction)
5. Confluence Engine
The built-in confluence system aggregates signals from all selected timeframes and calculates a percentage-based directional bias, giving traders a powerful decision-making edge.
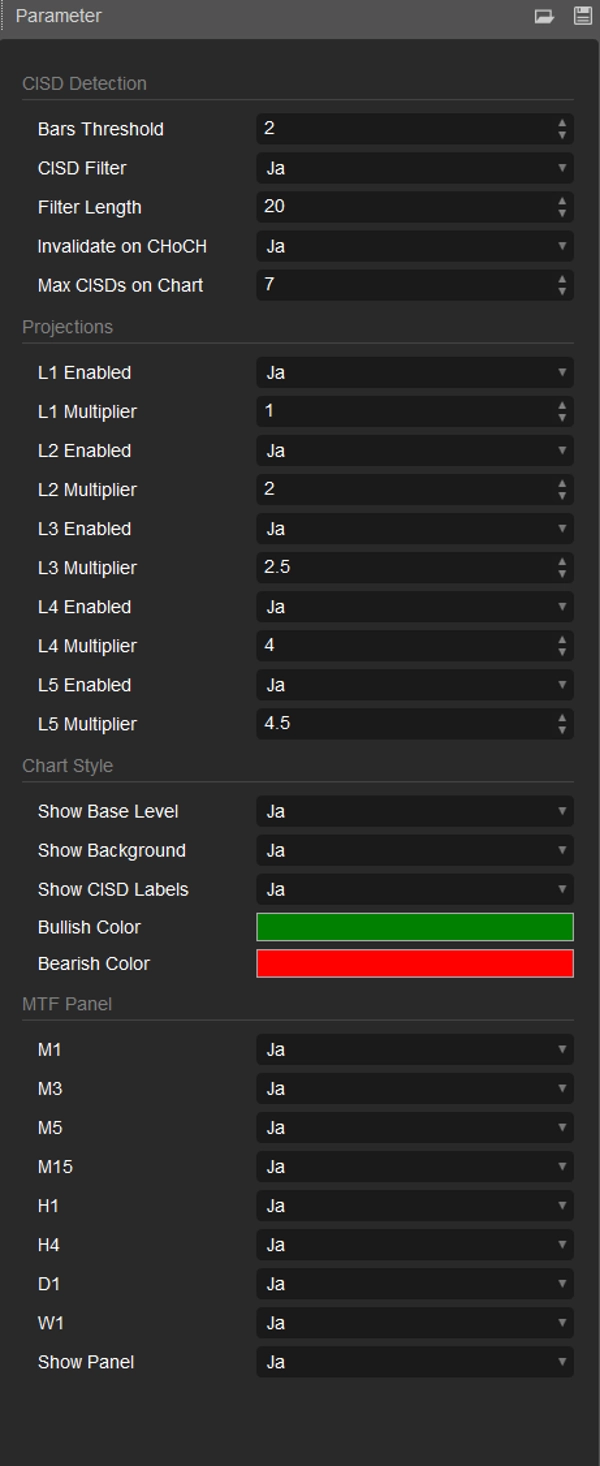
⚙️ Customization Options
- Enable/disable specific timeframes
- Adjust projection multipliers
- Toggle visual elements (background, labels, panel)
- Control number of displayed CISDs
🎯 Who is it for?
- Price action traders
- Smart money concept (SMC) users
- Intraday and swing traders
- Traders looking for structured, rule-based signals
🚀 Why use this indicator?
Instead of manually identifying structure shifts and projecting targets, this tool automates the entire process, providing clear, objective, and visually intuitive trading insights.
Summary
Key features include automatic detection of bullish and bearish CISD patterns with configurable validation thresholds and filters, and automatic invalidation upon market structure breaks. The indicator provides a clean, color-coded chart overlay highlighting active ranges and CISD zones, with optional labels and base level display.
A multi-timeframe (MTF) panel displays real-time bullish or bearish bias across multiple timeframes from 1 minute to 1 week, calculating confluence and generating signals such as BUY, SELL, LEAN BULL, LEAN BEAR, or WAITING. The built-in confluence engine aggregates signals from selected timeframes to provide a percentage-based directional bias.
Customization options allow enabling/disabling specific timeframes, adjusting projection multipliers, toggling visual elements, and controlling the number of displayed CISDs. This indicator is suited for price action traders, smart money concept users, and intraday or swing traders seeking structured, rule-based signals across various markets including Forex, indices, commodities, crypto, and stocks.
Customer reviews
5 | 50 % | |
4 | 50 % | |
3 | 0 % | |
2 | 0 % | |
1 | 0 % |


















!["Wyckoff Toolkit [Iridio Capital]" logo](https://cdn.ctrader.com/image/webp/5318c788-91ef-4297-bca6-4ce73b1516a8_61556)