Description
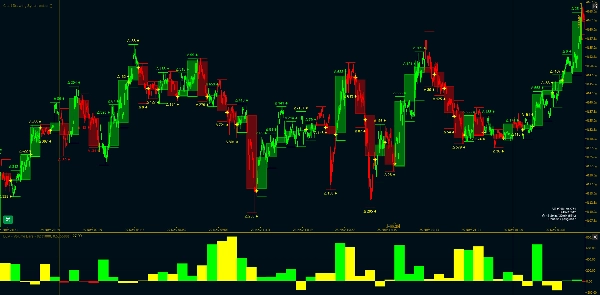
Tick Volume Bars is an information-driven bar sampling method that creates bars based on cumulative volume reaching an adaptive threshold. Unlike time-based bars, Volume Bars adjust to market activity levels using real-time flow imbalance measurements.
Best For: Traders who care about total participation and volume distribution.
Core Metric: Tick Volume (V) - Total market activity
Version 1.0
Use Comments Section to ask for more details
Available for Video Session with Setup Guide after Purchase
----------------------------------------------------------------------------------------------------------------------------------------
Core Concept
----------------------------------------------------------------------------------------------------------------------------------------
Traditional Time Bars: Fixed intervals (1 min, 5 min, etc.)
- Problem: Market activity varies dramatically
- Same time period can contain 10 ticks or 10,000 ticks
Volume Bars: Variable intervals based on Volume
- Solution: Bars complete when sufficient volume accumulated
- Adapts to market activity using EWMA threshold
----------------------------------------------------------------------------------------------------------------------------------------
Mathematical Framework
----------------------------------------------------------------------------------------------------------------------------------------
1. Tick Classification (Tick Rule) - Each tick is classified as buy or sell based on price movement.
2. EWMA Buy Proportion - Tracks the running proportion of buy ticks using exponential weighting.
3. Adaptive Threshold Calculation - The threshold adjusts based on the dominant flow direction.
4. Volume Accumulation - Track cumulative buy and sell volumes.
5. Bar Completion Condition - A bar completes when cumulative volume reaches the adaptive threshold.
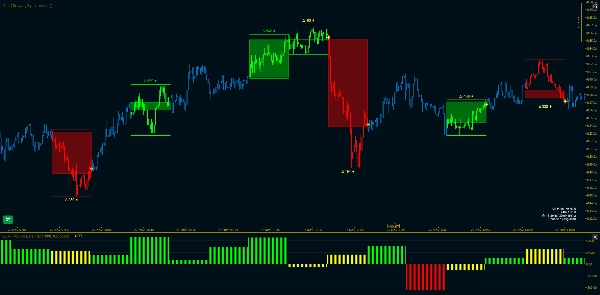
6. Delta Calculation - The delta measures order flow imbalance.
----------------------------------------------------------------------------------------------------------------------------------------
Parameter Reference
----------------------------------------------------------------------------------------------------------------------------------------
Core Settings
- Expected Bar Size E[T]: Target Volume per Bar
- EWMA Alpha: Smoothing factor
Fallback Mode
- Use Fallback Time-Based: Enable time-based bars ( enable sampling Volume data based on fixed time intervals)
- Fallback Minutes: Custom Time interval for data sampling
Daily Reset
- Daily Reset: Enable Volume Sampling Calculations Reset for each New Day / Session
- Reset Hour: Hour for reset
- Reset Minute: Minute for reset
- GMT Offset: Timezone offset
Volume Filter
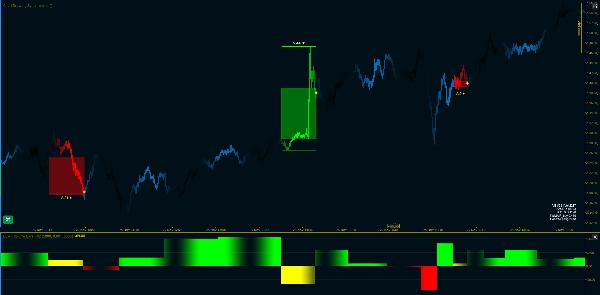
- Enable Volume Filter: Toggle filtering - indicator will display only Filtered Volume Bars
- Min Volume: Minimum volume threshold
Visual Settings
- Show Volume Bar Labels: Toggle labels
- Show Divergence Markers: Toggle divergence markers
- Color Chart Candles: Toggle chart coloring
- Bar Transparency: Volume Bars OHLC transparency
- Bull/Bear Colors: Volume Bars Colors
----------------------------------------------------------------------------------------------------------------------------------------
References
----------------------------------------------------------------------------------------------------------------------------------------
- López de Prado, M. - Advances in Financial Machine Learning
- Chapter on "Information-Driven Bars"
Summary
Key features include:
- Adaptive bar intervals based on volume rather than fixed time periods
- EWMA smoothing for threshold adjustment reflecting dominant market flow
- Optional fallback to time-based bars with customizable intervals
- Daily reset of volume sampling calculations with configurable reset time and timezone offset
- Volume filtering to display bars exceeding a minimum volume threshold
- Visual customization options such as volume bar labels, divergence markers, candle coloring, transparency, and color schemes for bullish/bearish bars
The indicator is designed for traders focused on total market participation and volume distribution across Forex, commodities, indices, and cryptocurrencies. It incorporates concepts from financial machine learning literature on information-driven bars.
Customer reviews
5 | 100 % | |
4 | 0 % | |
3 | 0 % | |
2 | 0 % | |
1 | 0 % |