
Price Change Bundle 1.0 BT
Indicator
2 purchases
Version 1.0, Aug 2025
Windows, Mac
4.0
Reviews: 1
Description
Price Change Bundle — 3 indicators, 1 logic.
The tools from my own setup (Supply & Demand + custom ZigZag). Built to show how price really moves around higher-TF closes.
Toggle any module on/off — enable/disable Levels, Bars, Histogram individually.
Modules
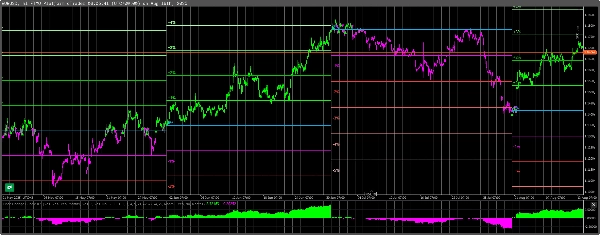
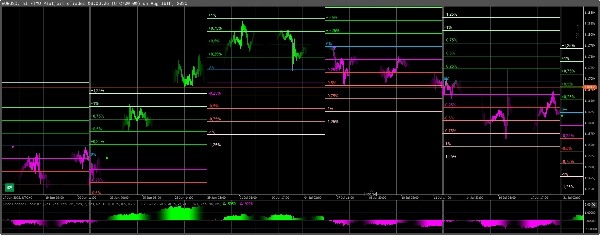
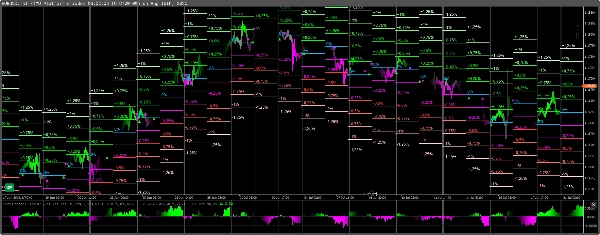
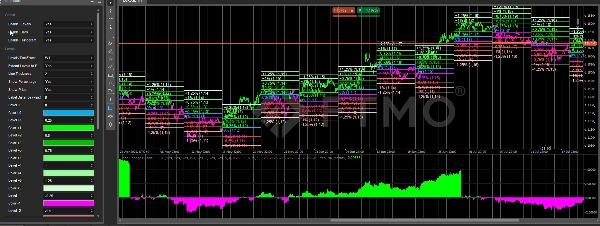
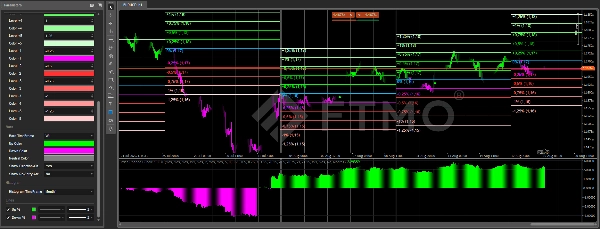
Price Change Levels
- Draws percentage zones (±0.25…±1.25%) in the selected timeframe.
- Each zone is measured from the 0% baseline and displays % and price.
- Option to extend lines to the end of the period for clean weekly/monthly maps.
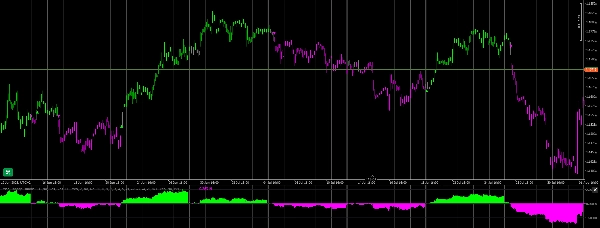
Price Change Bars
- Colors candles by Full Above/Below regime vs. the TF pivot.
- Best used on bar close for entries & a quick read of the regime.
- Includes Direction-Change & Re-Entry arrows (after neutral → same side).
Price Change Histogram
- Shows the overall percent development vs. the same TF reference (Up% / Down%).
- Great for spotting acceleration/slowdowns at a glance.
Why it works — “Secrets of Price Movement”
- Pros anchor to previous closes of higher TFs (MN/W1/D1).
- Measured % distances from that anchor act like practical magnets/targets.
- A candle fully above/below the pivot defines the regime; re-entry after neutral often continues the move.
Flexible use
- Pick any timeframe per module (e.g., MN Levels • W1 Bars • D1 Histogram).
- Works on any chart type, incl. Renko/range/tick (calculations use your selected time-based TFs).
- No repaint. Lightweight.
Video & Support
- A step-by-step video (installation, presets, trade examples) will be published soon.
- Buyers can contact me directly for any questions, setup help, or feedback. I reply personally.
Summary
AI summary
Price Change Bundle 1.0 BT is a composite indicator consisting of three modules—Levels, Bars, and Histogram—designed to analyze price movements relative to higher timeframe closes. It integrates concepts from Supply & Demand and a custom ZigZag to reveal how price behaves around significant reference points.
- Price Change Levels: Displays percentage zones (±0.25% to ±1.25%) from a 0% baseline within a selected timeframe, showing both percentage and price values. Lines can be extended to the period’s end for clear weekly or monthly mapping.
- Price Change Bars: Colors candles based on their position relative to the timeframe pivot, indicating regimes with full above/below coloring. Includes arrows signaling direction changes and re-entries after neutral phases, aiding entry decisions.
- Price Change Histogram: Illustrates overall percentage development (Up%/Down%) against the same timeframe reference, facilitating quick identification of acceleration or slowdowns.
Each module can be toggled on or off independently and configured with different timeframes. The indicator works on any chart type, including Renko, range, and tick charts, using time-based timeframe calculations. It anchors calculations to previous closes of higher timeframes (monthly, weekly, daily) and does not repaint. Buyers have access to direct support from the developer.
Indicator profile
Customer reviews
4.0
Reviews: 1
5 | 0 % | |
4 | 100 % | |
3 | 0 % | |
2 | 0 % | |
1 | 0 % |
Customer reviews
February 9, 2026
Price Change Bundle 1.0 BT delivers clear and practical price-change metrics. Best used on M10-H1, where momentum readings stay balanced and meaningful. Great for filtering weak moves, confirming impulse strength and improving intraday timing. A simple but effective companion for momentum-based strategies.
Discussion
FAQ
Prop
Forex
Signal
Breakout
Indices
Products available through cTrader Store, including trading bots, indicators and plugins, are provided by third-party developers and made available for informational and technical access purposes only. cTrader Store is not a broker and does not provide investment advice, personal recommendations or any guarantee of future performance.


Price
48
Sales
1.05K
Free installs