
Description
Camarilla by Bullitt Traders — Visualize Structure. Trade Precision.
A professional-grade Camarilla pivot indicator for cTrader, built to reveal how price reacts around institutional levels.
It automatically plots all key Camarilla levels (R1–R5 / S1–S5) and pivot points across multiple timeframes — giving traders a clear structural map for reversals and breakouts.
Main Features
- ✅ True Camarilla Formula — calculates levels from the previous period’s high, low, and close.
- 📊 Multi-TF Logic — choose between Daily, Weekly, or Monthly pivot periods.
- 🕒 Historical Mapping — automatically draws past periods for visual context and structure analysis.
- 🎨 Custom Styling — adjust line width, style, and color per regime (bullish, bearish, neutral).
- 💬 Labels & Prices — toggle text and value display for a clean or detailed layout.
- ⚡ Lightweight & Non-Repainting — optimized for speed and accuracy on any symbol.
- 🧩 Works on All Chart Types — time, range, tick, and Renko compatible.
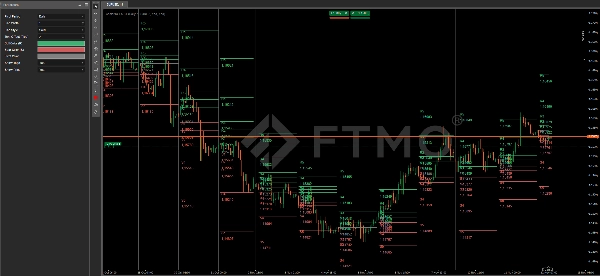
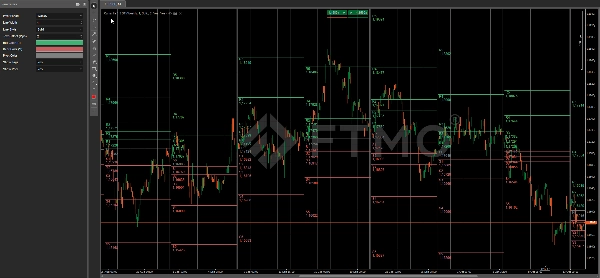
Camarilla Levels
R5 – Extreme breakout target zone
R4 – Major resistance, potential breakout trigger
R3 – Upper reversal zone, often used for short entries
R2 – Mid-level resistance
R1 – Initial resistance, early reaction level
PP – Central pivot point (mean-reversion zone)
S1 – Initial support, early reaction level
S2 – Mid-level support
S3 – Lower reversal zone, often used for long entries
S4 – Major support, potential breakout trigger
S5 – Extreme breakout target zone
Parameters
Pivot Period – choose Daily, Weekly, or Monthly for level calculation
Line Width – adjust overall line thickness
Line Style – set Solid, Dots, or Dashes
Text Offset (Pips) – distance between line and label
Bull Color (R) – color for resistance levels (R1–R5)
Bear Color (S) – color for support levels (S1–S5)
Pivot Color – color for the central pivot line (PP)
Show Tags – show or hide R/S level names
Show Price – show or hide numeric price labels
How to Use
R3–S3 zones → typical intraday reversal areas
R4–S4 levels → breakout or continuation confirmations
R5–S5 → high-volatility targets and exhaustion zones
Summary
Key features include automatic plotting of historical pivot levels for context, customizable line width, style, and colors for bullish, bearish, and neutral regimes, and options to show or hide level labels and price values. The indicator is lightweight, non-repainting, and compatible with various chart types such as time, range, tick, and Renko charts.
Camarilla levels serve specific roles: R3–S3 zones indicate typical intraday reversal areas; R4–S4 levels suggest breakout or continuation confirmations; and R5–S5 mark extreme breakout targets and high-volatility exhaustion zones. This tool provides a clear structural map to assist traders in identifying potential reversals, breakouts, and target zones across multiple markets including Forex, indices, commodities, cryptocurrencies, and stocks.
Customer reviews
5 | 100 % | |
4 | 0 % | |
3 | 0 % | |
2 | 0 % | |
1 | 0 % |


