
Description
The CRT (Candle Range Theory) indicator is a powerful analytical tool designed specifically for traders who follow the ICT (Inner Circle Trader) methodology. This indicator identifies essential candlestick patterns linked to the CRT, which is crucial for understanding market movements and price action.
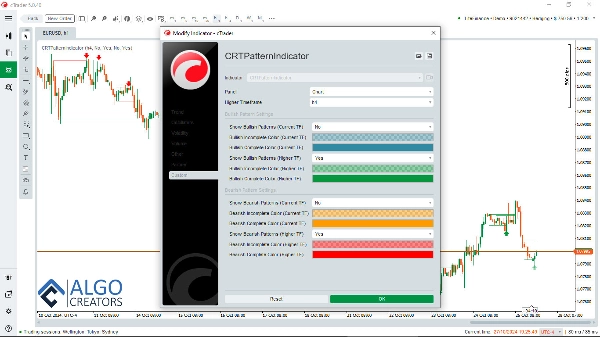
The cTrader CRT indicator comes equipped with multi-timeframe capabilities, allowing traders to view higher timeframe (HTF) CRT patterns while operating on lower timeframes (LTF). This functionality is vital for gaining insights into overall market structure and improving trading decisions.
Price movement and ICT Power of 3 (AMD):
The CRT indicator simplifies the analysis of price movements and pattern recognition associated with ICT’s Power of 3 (Anatomy of Market Dynamics - AMD).
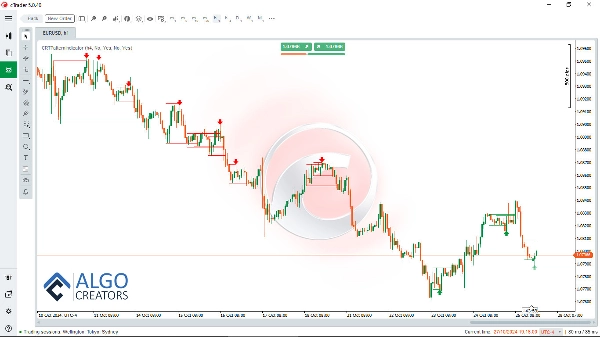
LTF CRT within a HTF CRT:
By effortlessly identifying the key points of support and resistance, traders can analyze price action with much greater clarity. Additionally, the CRT indicator highlights HTF and LTF patterns, helping traders navigate the dynamics of various market cycles.
use CRT indicator with other trading concepts:
Combining CRT with other trading concepts like FVGs, order blocks and turtle soup increases the probability of identifying successful trades.
Furthermore, the CRT indicator serves as an invaluable complement to the Smart Money Assistant indicator, an advanced tool designed to assist smart money traders with critical market insights and decision-making. Combined, these two indicators create a holistic trading toolbox that enhances the trader’s ability to analyze and act.
Download Smart Money Assistant: https://ctrader.com/algos/show/3956/
To further augment trading strategies, the FVG Finder indicator can be used alongside the CRT indicator. This tool detects Fair Value Gaps (FVGs) on the chart, which, when used in conjunction with CRT signals, increases the likelihood of making successful trades.
Download FVG finder indicator: https://ctrader.com/algos/show/3877/
By integrating these indicators, traders can establish a robust system that leverages high-probability setups, enabling them to effectively navigate the markets and optimize their trading outcomes.
Download CRT indicator with Alerts:: www[dot]AlgoCreators[dot]net
With the CRT, Smart Money Assistant, and FVG Finder in your toolkit, you can maximize your understanding of market trends and improve your overall trading performance, making it an essential resource for traders wishing to excel in the ICT trading style.
Summary
It simplifies the recognition of price movements related to ICT’s Power of 3 (Anatomy of Market Dynamics - AMD) and highlights critical support and resistance levels. By displaying both higher and lower timeframe patterns, it helps traders interpret market cycles more clearly.
The CRT indicator can be combined with other trading concepts such as Fair Value Gaps (FVGs), order blocks, and turtle soup patterns to enhance trade identification. It also complements the Smart Money Assistant indicator, providing a comprehensive toolkit for smart money trading analysis.
Additionally, pairing the CRT indicator with the FVG Finder, which detects Fair Value Gaps, can improve the probability of successful trades. Together, these tools support the development of robust trading strategies aligned with the ICT style.
Customer reviews
5 | 83 % | |
4 | 17 % | |
3 | 0 % | |
2 | 0 % | |
1 | 0 % |


!["Smart Money Concepts (SMC) [Iridio Capital]" logo](https://cdn.ctrader.com/image/webp/28b69fd1-ef54-4bed-9487-07e78e883be4_40934)
