Description
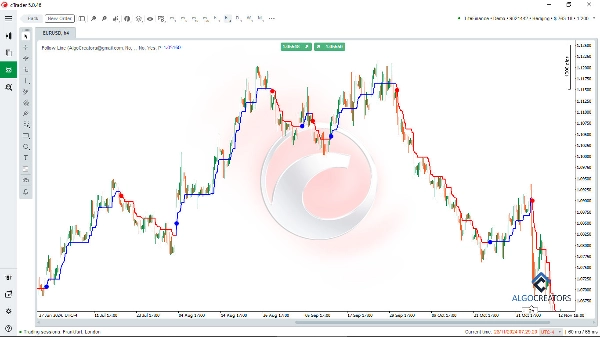
The Follow Line indicator is a powerful cTrader indicator for technical analysis, helping traders identify optimal entry and exit points in financial markets. By combining Bollinger Bands and the ATR indicator, it filters trends and provides reliable buy and sell signals.
With this indicator, you can easily spot upward or downward market trends and follow high-confidence signals.
Traders can combine the Follow Line Indicator with advanced tools like the cTrader Smart Money Assistant indicator and oscillators link MACD to enhance their analysis and confirm trade entries.
Its customizable settings and real-time alerts make it a valuable addition to any trading strategy, enabling users to execute successful trades with confidence and accuracy.
Key Features:
- Trend Detection: Use the Follow Line to identify bullish or bearish market trends.
- Buy/Sell Signals: Display accurate buy and sell signals based on Bollinger Bands breakouts.
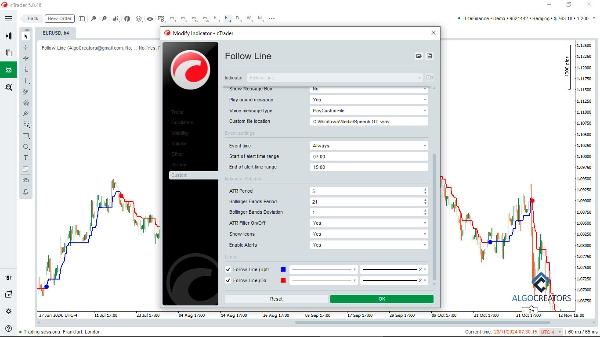
- ATR Filter: Option to enable or disable the ATR filter for enhanced signal accuracy.
- Customizable Settings: Adjust Bollinger Bands period, standard deviation, and ATR period.
- Visual Representation: Show signals on the chart using intuitive icons (arrows or lines).
- Alerts: Get instant alerts whenever a buy or sell signal appears.
This indicator is highly customizable, allowing traders to adjust Bollinger Bands periods, standard deviations, and ATR settings to suit their strategy. Visual cues and instant alerts make it user-friendly and effective for both scalping and swing trading. With features like trend detection, risk management, and customizable settings, the Follow Line Indicator is ideal for forex, cryptocurrency, and stock traders aiming to enhance their technical analysis and trading performance.
Perfect for identifying precise market opportunities!
Summary
Users can customize settings such as Bollinger Bands period, standard deviation, and ATR period to align with their trading strategies. The indicator visually represents signals on the chart using intuitive icons like arrows or lines and provides real-time alerts when signals occur. It supports various trading styles, including scalping and swing trading, and is suitable for forex, cryptocurrency, and stock markets.
The Follow Line indicator can be combined with other tools like the cTrader Smart Money Assistant and MACD oscillators to confirm trade entries and enhance analysis. Its customizable features and alert system assist traders in identifying precise market opportunities and managing risk effectively.
Customer reviews
5 | 60 % | |
4 | 20 % | |
3 | 20 % | |
2 | 0 % | |
1 | 0 % |