
Description
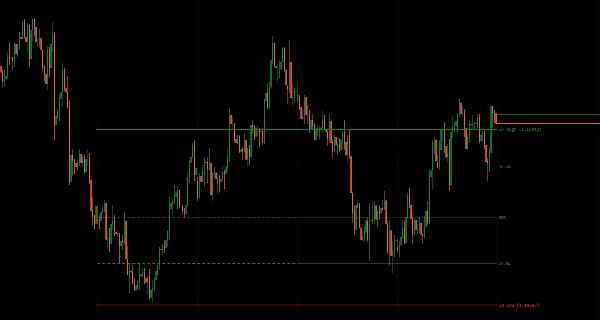
Opening range structure across any period—intraday sessions to yearly cycles—with Fibonacci levels and extension projections.
Marks High/Low range established during opening periods (Daily, Weekly, Monthly, Quarterly, Yearly, or Custom Range) as reference for breakouts, mean reversion, and volatility expectations.
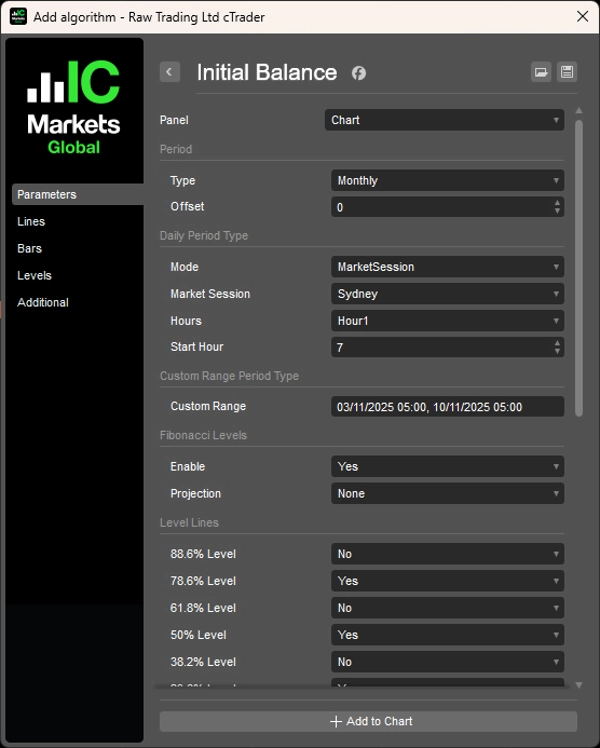
Eight period types with timezone-aware session detection (Sydney/Tokyo/London/NY), historical offset for multi-period comparison, optional seven Fibonacci levels (11.4% to 88.6%) inside IB range, upward/downward projections from boundaries, flexible line extension control (IB period only, current bar, or N periods forward), and precision period detection deliver comprehensive opening range analysis for traders targeting structure-based setups across all timeframes.
FEATURES
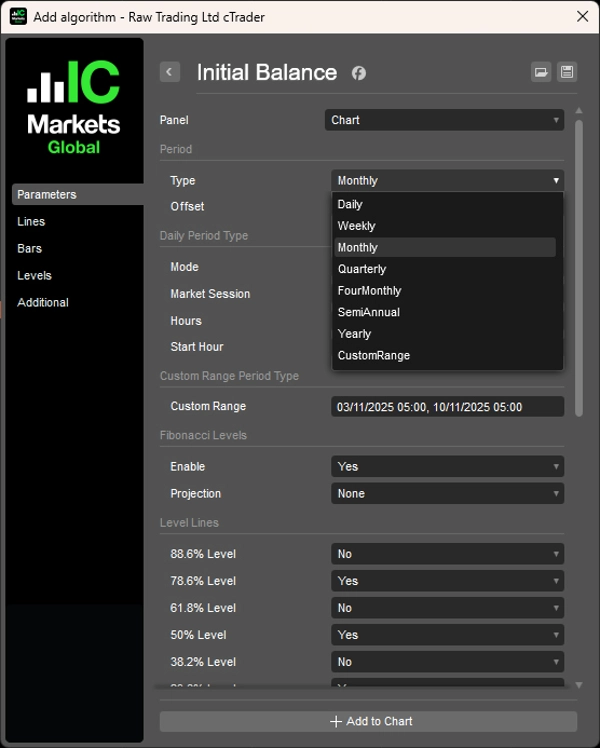
8 Period Types
- Daily, Weekly, Monthly, Quarterly, 4-Month, Semi-Annual, Yearly, Custom Range
- Daily Modes: Hours-based (1-12 hours) or Market Session (Sydney/Tokyo/London/NY)
- Configurable session start times with timezone-aware UTC offset adjustment
- Custom Range: Define exact start/end datetime for event-based analysis
Historical Periods
- Offset parameter to view past IB ranges (e.g., last week's IB, last month's IB)
- Compare current price action against previous period structures
- Multi-period analysis for trend confirmation
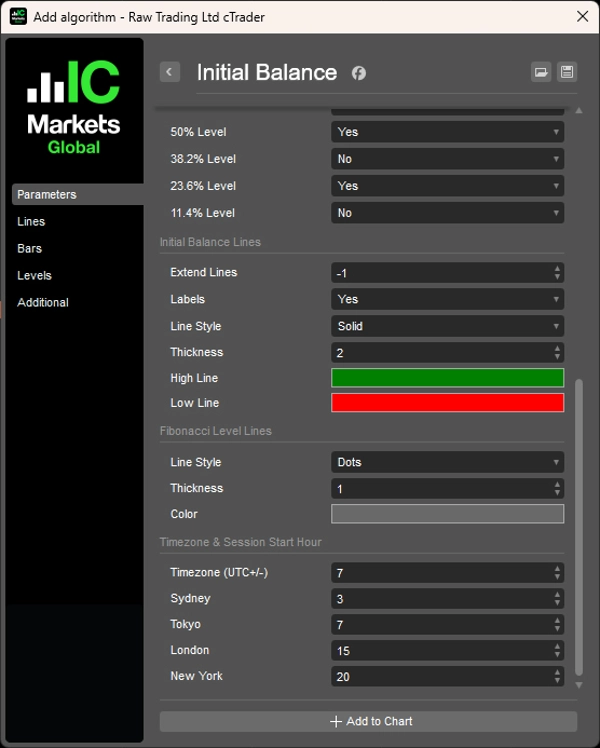
Fibonacci Levels
- Optional 7 levels (11.4%, 23.6%, 38.2%, 50%, 61.8%, 78.6%, 88.6%) inside IB range
- Mean reversion zones within the balance
- Precise entry/exit reference points
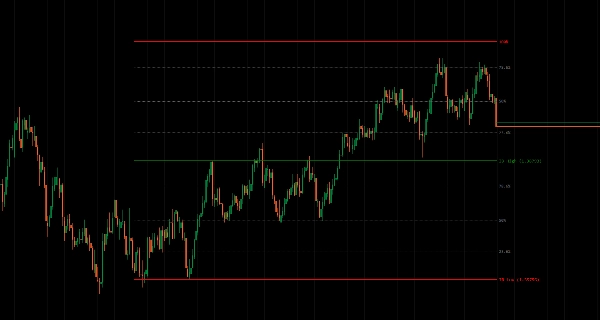
Fibonacci Projections
- Project levels upward/downward from IB high/low
- Potential breakout targets beyond the range
- Extension zones for directional moves
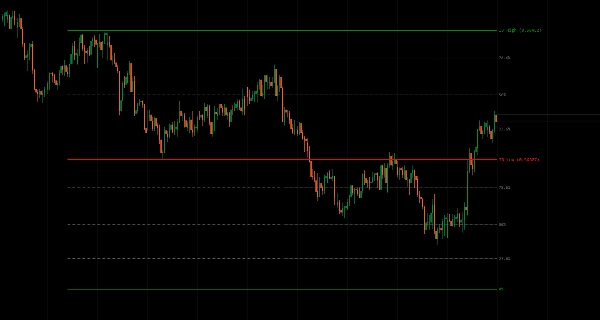
Line Extension Control
- IB period only: Show range during formation period
- Current bar: Extend to present
- N periods forward: Project into future for planning
- Clean visual management
Precision Period Detection
- Accurate opening range calculation for each period type
- Timezone-aware for global markets
- Handles session overlaps and transitions cleanly
__________________________________________________________________________________________
MORE FREE INDICATORS
Explore a wide range of market analysis tools—from structure and volume to regression, volatility, and custom timeframes.
Source code is available on GitHub repository.
All free to use. But if you feel like sending coffee support, you can route it here.
Support/Resistance
Volume
- Volume Activity Profiler
- Volume Efficiency Analyzer
- Volume Profile Analytics
- Volume Profile - Updated
- Volume Spread Analysis
- VWAP (Volume Weighted Average Price)
Moving Averages
- SSL Channel
- Anchored Moving Average
- Deviation-Scaled Moving Average
- Gann High Low Activator
- Instantaneous Trendline
- Kaufman Adaptive MA with Trend Vision
- Moving Average Channel
- Moving Averages Suite
- Trend Channel Moving Average
Utilities/Custom
Regression-Based
Volatility
Oscillators
__________________________________________________________________________________________
DISCLAIMER
Trading involves risk. This indicator is intended for technical analysis only — always apply proper risk management and trade responsibly.
FEECBACK & IMPROVEMENTS
If you have suggestions, feature requests, or ideas for enhancement, please leave a comment in the Discussion tab. Your feedback helps improve the indicator for everyone.
Summary
Key features include configurable session start times with UTC offset adjustments, historical offset parameters for comparing past initial balance ranges, and multi-period analysis for trend confirmation. It offers optional Fibonacci retracement levels (11.4% to 88.6%) within the initial balance range to highlight mean reversion zones and precise entry or exit points. Additionally, Fibonacci projections extend upward or downward from the initial balance boundaries to indicate potential breakout targets and directional extension zones.
Line extension controls allow users to display the range during its formation, extend it to the current bar, or project it forward for planning purposes. The indicator ensures precise period detection, handling session overlaps and transitions accurately for global market analysis. This tool aids traders in identifying breakout, mean reversion, and volatility expectations based on opening range structures across all timeframes.
Customer reviews
5 | 50 % | |
4 | 50 % | |
3 | 0 % | |
2 | 0 % | |
1 | 0 % |


