Description
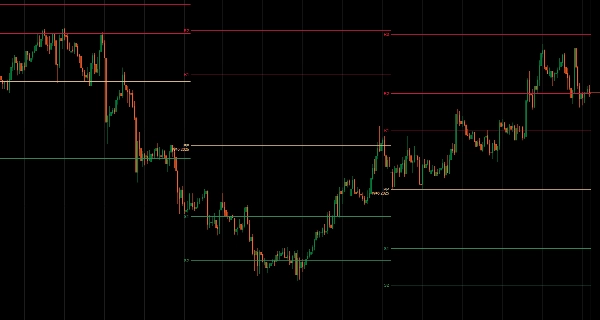
Calculate support and resistance levels using five professional pivot methods across any timeframe.
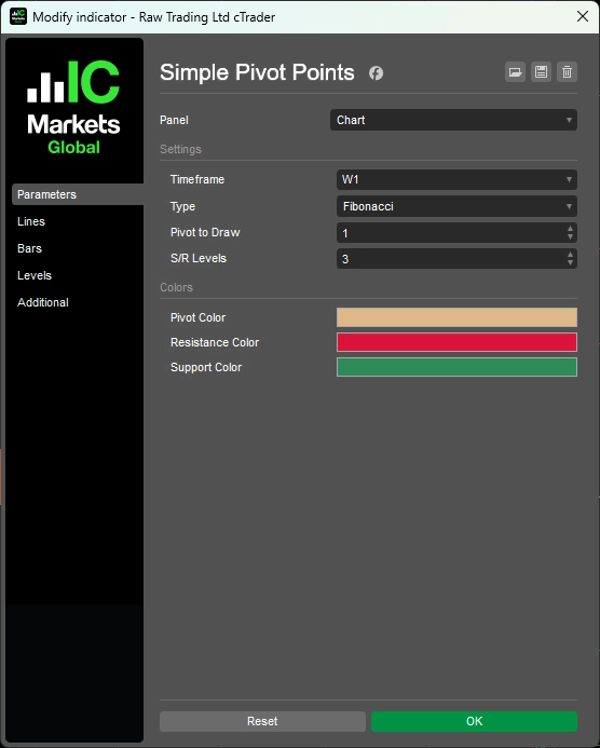
Automatically generates pivot levels (Standard, Fibonacci, Woodie, Camarilla, DeMark) from M5 to Monthly data with time-bound display for each period.
Five calculation algorithms with distinct S/R spacing logic, configurable support/resistance levels (0-6 per side), historical pivot display for multiple previous periods, auto-labeled lines (PP, R1-R6, S1-S6), and color-coded visualization deliver institutional-grade pivot analysis for traders targeting key price levels and intraday reversals.
FEATURES
Five Calculation Methods
- Standard: Classic floor trader formula—the most widely watched pivots globally
- Fibonacci: Uses Fib ratios (38.2%, 61.8%, 100%, 138.2%, 161.8%) for S/R spacing
- Woodie: Weights the close price heavily—more reactive to recent price action
- Camarilla: Tight intraday levels using 1.1/12 multipliers—popular for scalping
- DeMark: Conditional formula based on close vs. open relationship—only 1 S/R level but highly respected
Full Customization
- Any timeframe: Calculate from M5, H1, H4, Daily, Weekly, Monthly data
- Historical pivots: Show up to multiple previous periods (e.g., last 3 weeks of pivots)
- Configurable levels: Display 0-6 support/resistance levels per side
- Auto-labeled lines: PP, R1-R6, S1-S6 clearly marked
- Time-bound lines: Each period's pivots displayed only for that period's duration
- Color-coded: Pivot (tan), Resistance (red), Support (green)
__________________________________________________________________________________________
MORE FREE INDICATORS
Explore a wide range of market analysis tools—from structure and volume to regression, volatility, and custom timeframes.
Source code is available on GitHub repository.
All free to use. But if you feel like sending coffee support, you can route it here.
Support/Resistance
Volume
- Volume Activity Profiler
- Volume Efficiency Analyzer
- Volume Profile Analytics
- Volume Profile - Updated
- Volume Spread Analysis
- VWAP (Volume Weighted Average Price)
Moving Averages
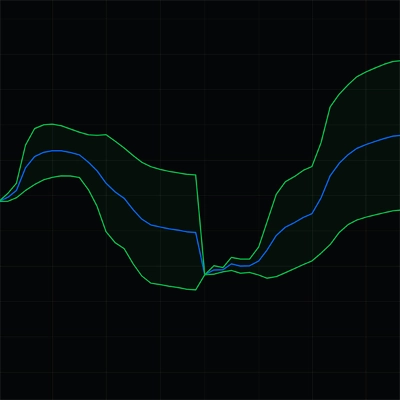
- SSL Channel
- Anchored Moving Average
- Deviation-Scaled Moving Average
- Gann High Low Activator
- Instantaneous Trendline
- Kaufman Adaptive MA with Trend Vision
- Moving Average Channel
- Moving Averages Suite
- Trend Channel Moving Average
Utilities/Custom
Regression-Based
Volatility
Oscillators
__________________________________________________________________________________________
DISCLAIMER
Trading involves risk. This indicator is intended for technical analysis only — always apply proper risk management and trade responsibly.
FEECBACK & IMPROVEMENTS
If you have suggestions, feature requests, or ideas for enhancement, please leave a comment in the Discussion tab. Your feedback helps improve the indicator for everyone.
Summary
Customer reviews
5 | 100 % | |
4 | 0 % | |
3 | 0 % | |
2 | 0 % | |
1 | 0 % |