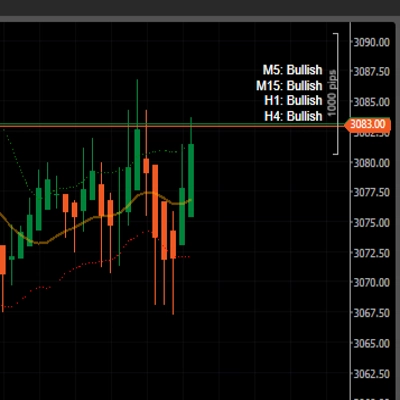
Description
OVERVIEW
The Waddah Attar Explosion (WAE) indicator was created by Ahmad Waddah Attar and introduced to the trading community in 2007. It combines MACD momentum measurement with Bollinger Bands volatility analysis to identify "price explosion" moments—periods when price transitions from consolidation into strong directional movement.
The indicator answers two questions:
- Is momentum building? (measured by MACD rate of change)
- Is volatility expanding? (measured by Bollinger Bands width)
When both conditions align above a noise filter (Dead Zone), it signals a potential explosive move.
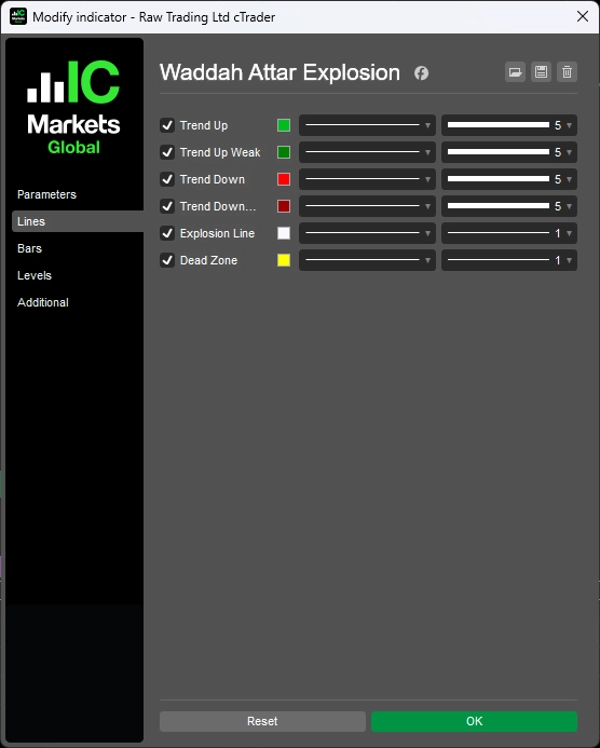
COMPONENTS
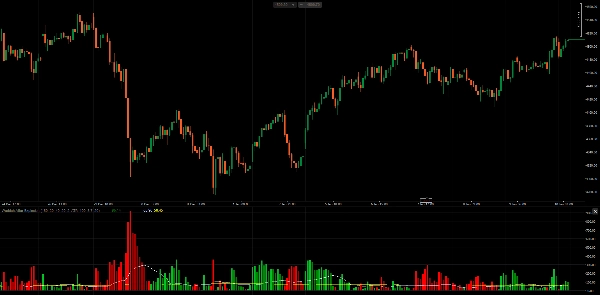
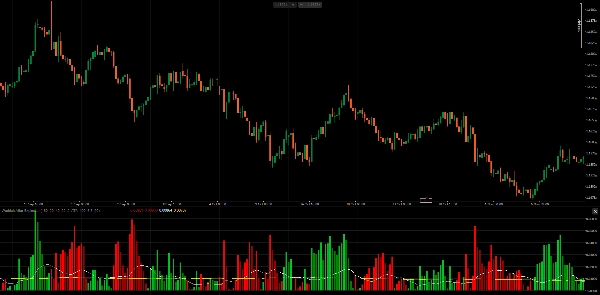
1. Trend Histogram (Green/Red) Displays the rate of change of the MACD line, multiplied by a sensitivity factor.
- Calculation:
(MACD_current - MACD_previous) × Sensitivity - Green bars: Bullish momentum (MACD accelerating upward)
- Red bars: Bearish momentum (MACD accelerating downward)
- Bright color: Momentum increasing compared to previous bar
- Dark color: Momentum decreasing compared to previous bar
2. Explosion Line (White) Represents the width of the Bollinger Bands, indicating volatility expansion or contraction.
- Calculation:
BB_Upper - BB_Lower - Rising: Volatility expanding (potential breakout)
- Falling: Volatility contracting (consolidation)
3. Dead Zone (Yellow) A threshold filter to eliminate weak signals caused by market noise.
- ATR-based: Adapts to current market volatility
- Fixed Pips: Static threshold value
HOW AHMAD WADDAH ATTAR USES IT
According to the original author:
Entry Rules for Buy All conditions must be met:
- Green histogram is rising
- Green histogram is above the Explosion Line
- Explosion Line is rising
- Both green histogram and Explosion Line are above the Dead Zone
Entry Rules for Sell All conditions must be met:
- Red histogram is rising
- Red histogram is above the Explosion Line
- Explosion Line is rising
- Both red histogram and Explosion Line are above the Dead Zone
Exit Rules
- Exit long when green histogram crosses below the Explosion Line
- Exit short when red histogram crosses below the Explosion Line
Key Insight The angle of the Explosion Line matters. When the Explosion Line is angled upward and the histogram breaks above it, this confirms that volatility is actively increasing—the "explosion" is real, not a false signal.
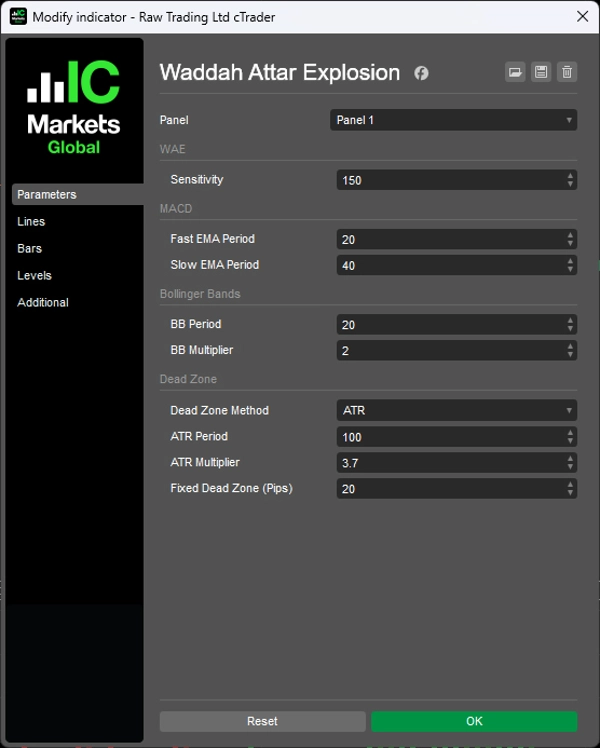
PARAMETERS
1. Sensitivity
- Sensitivity (150): Multiplier for MACD rate of change
2. MACD
- Fast EMA Period (20): Fast moving average for MACD calculation
- Slow EMA Period (40): Slow moving average for MACD calculation
3. Bollinger Bands
- BB Period (20): Bollinger Bands lookback period
- BB Multiplier (2.0): Standard deviation multiplier
4. Dead Zone
- Dead Zone Method (ATR): Choose between ATR-based or Fixed Pips
- ATR Period (100): Period for ATR calculation
- ATR Multiplier (3.7): Multiplier applied to ATR for Dead Zone
- Fixed Dead Zone (20): Dead Zone value in pips (when using Fixed method)
NOTES
- The indicator works on all timeframes. The original author recommended H1 and M30.
- ATR-based Dead Zone is recommended as it adapts to different instruments and market conditions.
- The Sensitivity parameter may need adjustment based on timeframe and instrument volatility.
- This indicator identifies momentum and volatility alignment—it does not predict direction on its own. Consider using it alongside trend analysis or support/resistance levels.
__________________________________________________________________________________________
MORE FREE INDICATORS
Explore a wide range of market analysis tools—from structure and volume to regression, volatility, and custom timeframes.
Source code is available on GitHub repository.
All free to use. But if you feel like sending coffee support, you can route it here.
Support/Resistance
Volume
- Volume Activity Profiler
- Volume Efficiency Analyzer
- Volume Profile Analytics
- Volume Profile - Updated
- Volume Spread Analysis
- VWAP (Volume Weighted Average Price)
Moving Averages
- SSL Channel
- Anchored Moving Average
- Deviation-Scaled Moving Average
- Gann High Low Activator
- Instantaneous Trendline
- Kaufman Adaptive MA with Trend Vision
- Moving Average Channel
- Moving Averages Suite
- Trend Channel Moving Average
Utilities/Custom
Regression-Based
Volatility
Oscillators
__________________________________________________________________________________________
DISCLAIMER
Trading involves risk. This indicator is intended for technical analysis only — always apply proper risk management and trade responsibly.
FEECBACK & IMPROVEMENTS
If you have suggestions, feature requests, or ideas for enhancement, please leave a comment in the Discussion tab. Your feedback helps improve the indicator for everyone.