
Description
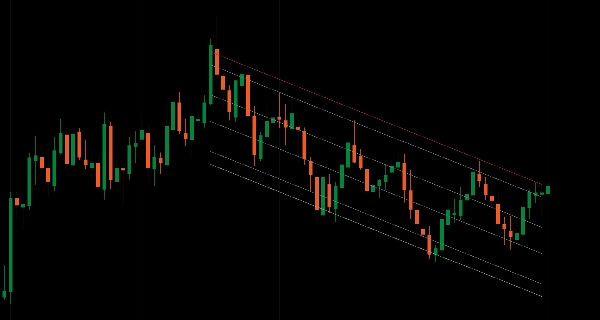
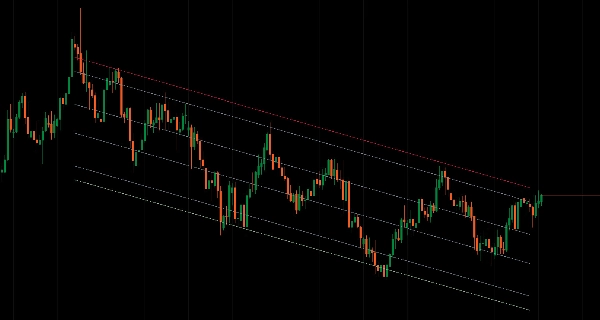
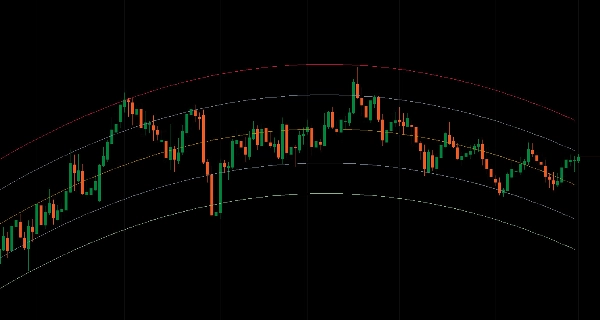
Statistical regression channels with Fibonacci levels across multiple calculation types, timeframes, and date ranges.
Fits regression lines through price data using eight methods (Linear, Logarithmic, Exponential, Weighted, Polynomial, Moving, Exponential Moving, LOWESS) with standard deviation bands for mean reversion analysis.
Nine Fibonacci channel levels (0% to 100%), multi-timeframe analysis across 16 periods with interpolated rendering, three calculation modes (Period-Based, Date Range, MTF), polynomial degree control (1-5) for curved trend structures, standard deviation multiplier for channel width adjustment, timezone-aware datetime parsing for event analysis, extend-to-infinity trendline projection, and optimized LRU caching deliver comprehensive statistical regression analysis for traders targeting mean reversion zones and curved price structures across market conditions.
FEATURES
8 Regression Calculation Types
- Linear: Classic least-squares linear regression
- Logarithmic: Natural log-based regression for exponential price moves
- Exponential: Exponential curve fitting for accelerating trends
- Weighted: Linear regression with recent bars weighted more heavily
- Polynomial: Curved fits (degree 1-5) for non-linear trends
- Moving: Moving average-based regression
- Exponential Moving: EMA-based regression for trend smoothing
- LOWESS: Locally weighted regression for adaptive smoothing
9 Fibonacci Channel Levels
- Full channel range: 100% (upper), 88.6%, 76.4%, 61.8%, 50% (midline), 38.2%, 23.6%, 11.4%, 0% (lower)
- Mean reversion zones within regression bands
- Precise support/resistance reference points
- Independent color/style/thickness control for each level
Multi-Timeframe Analysis
- Calculate regression on higher timeframe, display on current chart
- 16 timeframes available (m1 to Monthly)
- Interpolated channel values for smooth rendering across chart bars
- Higher timeframe structure without switching charts
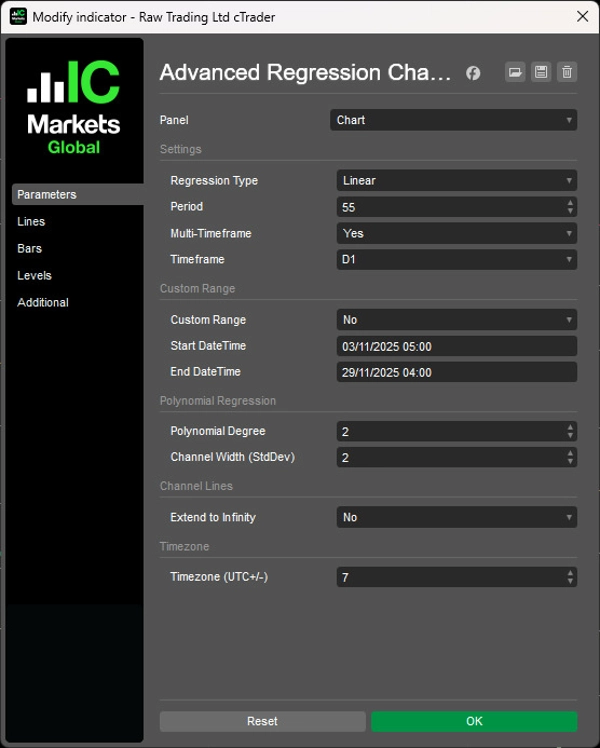
3 Calculation Modes
- Period-Based: Rolling window of N bars (default)
- Date Range: Custom start/end datetime for specific events or phases with Timezone-aware datetime parsing (UTC+/- offset)
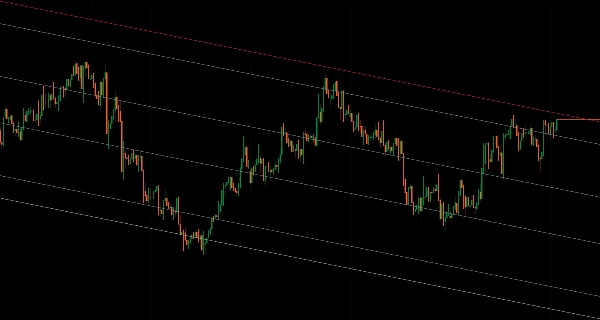
Channel Display Options
- Standard Output: Plot all 9 levels as indicator lines
- Extend to Infinity: Render as trendlines that project forward indefinitely
- Automatic refresh when colors/styles change
- Clean rendering—no residual values beyond calculation window
Date Range Mode
- Define exact start/end dates (dd/MM/yyyy HH:mm format)
- Analyze specific market events, phases, or structure
- Independent of period parameter
- Timezone conversion from user local time to server time
Dynamic Calculation
- Real-time updates as new bars form
- Optimized LRU caching with dirty-range tracking
- Adaptive cache sizing based on timeframe
- Binary search for fast date range lookups
Channel Width Control
- Standard deviation multiplier (default 2.0)
- Wider bands for volatility expansion
- Tighter bands for range-bound markets
- Consistent across all regression types
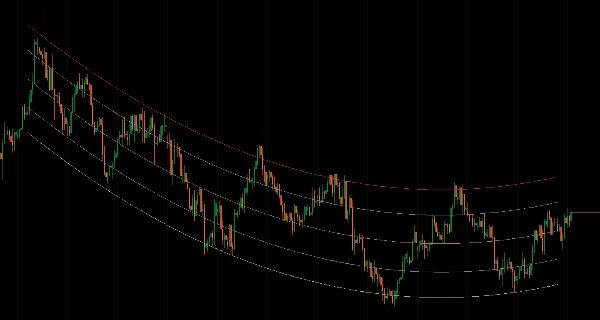
Polynomial Regression
- Degree control: 1-5 (higher = more curvature)
- Captures non-linear trends
- Useful for parabolic or curved price structures
- Falls back to linear when degree = 1
Clean Visual Management
- No calculation on forming bar—only completed bars
- Proper multi-timeframe truncation—lines end at last completed HTF bar
- Slope-based extrapolation for consistent directional projection
- Clear output series with descriptive level names
__________________________________________________________________________________________
MORE FREE INDICATORS
Explore a wide range of market analysis tools—from structure and volume to regression, volatility, and custom timeframes.
Source code is available on GitHub repository.
All free to use. But if you feel like sending coffee support, you can route it here.
Support/Resistance
Volume
- Volume Activity Profiler
- Volume Efficiency Analyzer
- Volume Profile Analytics
- Volume Profile - Updated
- Volume Spread Analysis
- VWAP (Volume Weighted Average Price)
Moving Averages
- SSL Channel
- Anchored Moving Average
- Deviation-Scaled Moving Average
- Gann High Low Activator
- Instantaneous Trendline
- Kaufman Adaptive MA with Trend Vision
- Moving Average Channel
- Moving Averages Suite
- Trend Channel Moving Average
Utilities/Custom
Regression-Based
Volatility
Oscillators
__________________________________________________________________________________________
DISCLAIMER
Trading involves risk. This indicator is intended for technical analysis only — always apply proper risk management and trade responsibly.
FEECBACK & IMPROVEMENTS
If you have suggestions, feature requests, or ideas for enhancement, please leave a comment in the Discussion tab. Your feedback helps improve the indicator for everyone.
Summary
It offers multi-timeframe analysis across 16 periods (from 1 minute to monthly), enabling regression calculations on higher timeframes displayed on the current chart with smooth interpolated rendering. Users can select among three calculation modes: Period-Based (rolling window), Date Range (custom start/end with timezone-aware parsing), and Multi-Timeframe. Channel width is adjustable via a standard deviation multiplier to reflect market volatility.
The indicator features real-time dynamic updates, optimized caching for performance, and extend-to-infinity trendline projections for forward-looking analysis. Visual output is clean, with slope-based extrapolation and no calculations on forming bars. This tool is designed for traders analyzing mean reversion and complex price structures across various market conditions.


