
Description
Adaptive trend analysis using kernel-weighted regression mathematics.
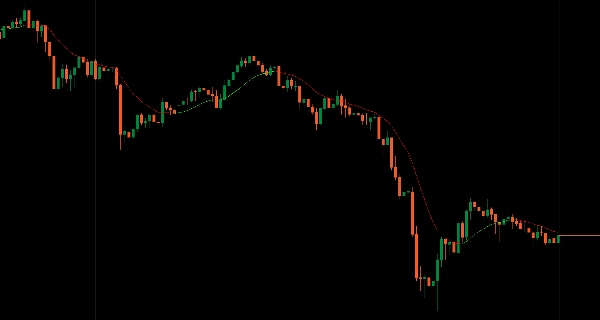
Applies Gaussian kernel weighting where nearby bars influence more and distant bars fade exponentially, creating ultra-smooth trend lines without fixed-period lag.
Automatic adjustment to local price structure, minimal lag compared to traditional moving averages, dynamic color coding (Lime uptrend, Red downtrend), adjustable bandwidth for responsiveness tuning, flexible lookback window (50-2000 bars), and two-color noise-free design deliver mathematically precise trend identification for traders seeking adaptive smoothing without arbitrary period selection.
FEATURES
Kernel-Weighted Calculation
- Nearby bars influence more, distant bars fade exponentially—no arbitrary fixed periods
- Gaussian kernel weighting for mathematically optimal smoothing
- Automatically adjusts to local price structure without manual recalibration
- Minimal lag: Responds faster to genuine trend changes than equivalent moving averages
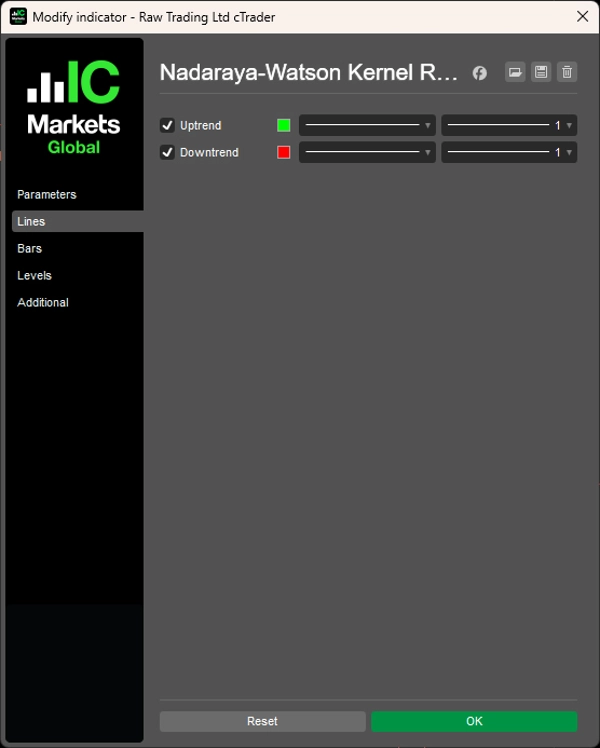
Dynamic Color Coding
- Lime: Uptrend
- Red: Downtrend
- Instant visual confirmation of trend direction
- Discontinuous line display: Color changes are instant and visually clear
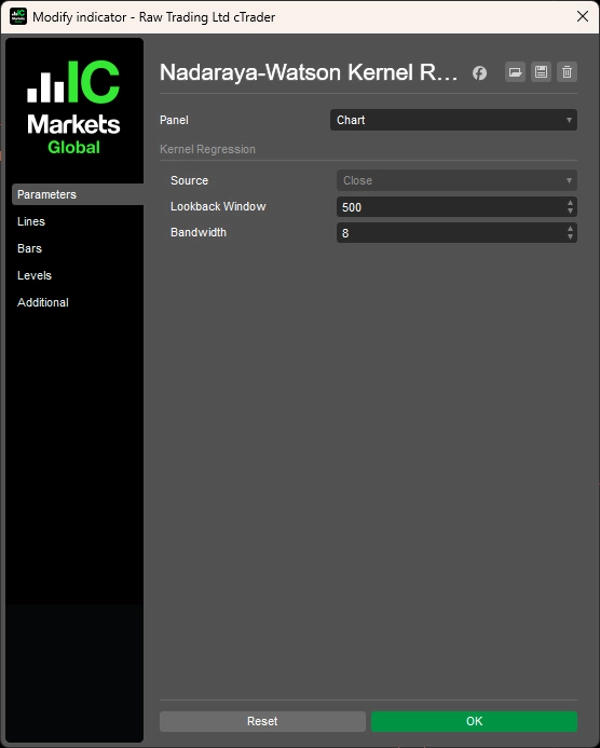
Adjustable Parameters
- Bandwidth: Fine-tune responsiveness vs. smoothness
- Flexible lookback window: 50-2000 bars to match your timeframe
- Adapts to different market conditions and trading styles
Clean Design
- Two colors, zero clutter—either trending up or trending down
- Noise-free trend identification
- No complex settings required
- Visual simplicity with mathematical precision
__________________________________________________________________________________________
MORE FREE INDICATORS
Explore a wide range of market analysis tools—from structure and volume to regression, volatility, and custom timeframes.
Source code is available on GitHub repository.
All free to use. But if you feel like sending coffee support, you can route it here.
Support/Resistance
Volume
- Volume Activity Profiler
- Volume Efficiency Analyzer
- Volume Profile Analytics
- Volume Profile - Updated
- Volume Spread Analysis
- VWAP (Volume Weighted Average Price)
Moving Averages
- SSL Channel
- Anchored Moving Average
- Deviation-Scaled Moving Average
- Gann High Low Activator
- Instantaneous Trendline
- Kaufman Adaptive MA with Trend Vision
- Moving Average Channel
- Moving Averages Suite
- Trend Channel Moving Average
Utilities/Custom
Regression-Based
Volatility
Oscillators
__________________________________________________________________________________________
DISCLAIMER
Trading involves risk. This indicator is intended for technical analysis only — always apply proper risk management and trade responsibly.
FEECBACK & IMPROVEMENTS
If you have suggestions, feature requests, or ideas for enhancement, please leave a comment in the Discussion tab. Your feedback helps improve the indicator for everyone.
Summary
Key features include dynamic color coding with lime indicating uptrends and red indicating downtrends, offering instant visual confirmation of trend direction through a noise-free, two-color design. Users can fine-tune the indicator’s responsiveness and smoothness via adjustable bandwidth and select a flexible lookback window ranging from 50 to 2000 bars to suit various timeframes and market conditions.
The indicator emphasizes mathematical precision and visual simplicity, requiring no complex settings. It is designed for traders seeking an adaptive smoothing method for trend identification without arbitrary period selection. This tool supports scalping strategies and is part of a broader suite of market analysis indicators focused on regression, volume, volatility, and custom timeframes.
Customer reviews
5 | 100 % | |
4 | 0 % | |
3 | 0 % | |
2 | 0 % | |
1 | 0 % |


