Description
Chart control panel for faster navigation — zoom, timeframe, and chart setup without leaving the chart.
Zoom presets, manual zoom entry, full timeframe and chart selector, configurable favorite timeframes, period separators, round numbers grid, and live bid/ask lines — all accessible through on-chart UI buttons. Designed to reduce time spent navigating cTrader's native menus during active trading sessions.
FEATURES
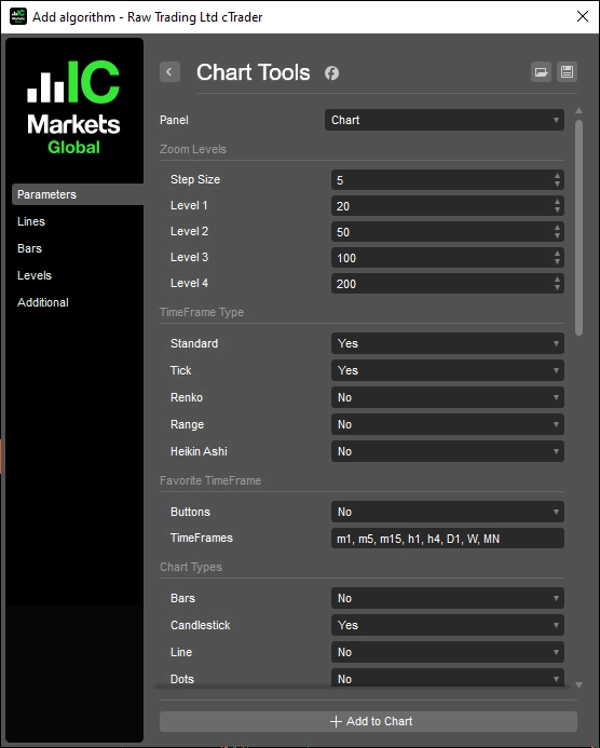
Zoom Controls
- Zoom in / zoom out with configurable step size
- Four configurable preset zoom levels for one-click access
- Manual zoom entry with apply button
- Syncs with cTrader's native zoom events
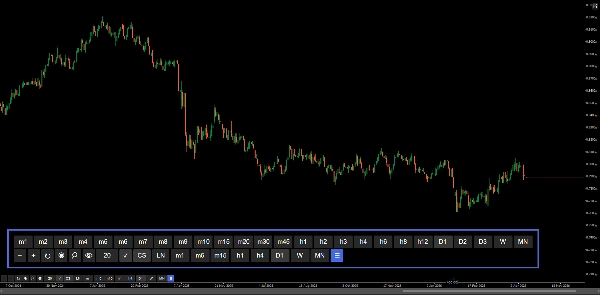
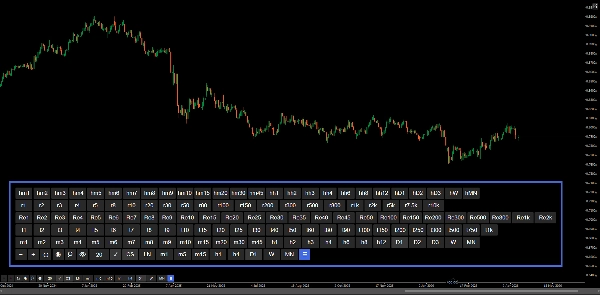
Timeframe Selector
- Full button panel covering all timeframe types: Standard, Heikin Ashi, Renko, Range, Tick
- All mode displays every type as separate rows
- Active timeframe highlighted automatically
- Toggle panel visibility with the ☰ button
Favorite Timeframes
- Configurable quick-access row via comma-separated input (e.g. m1, h1, D1)
- Supports all timeframe types including Range and Tick
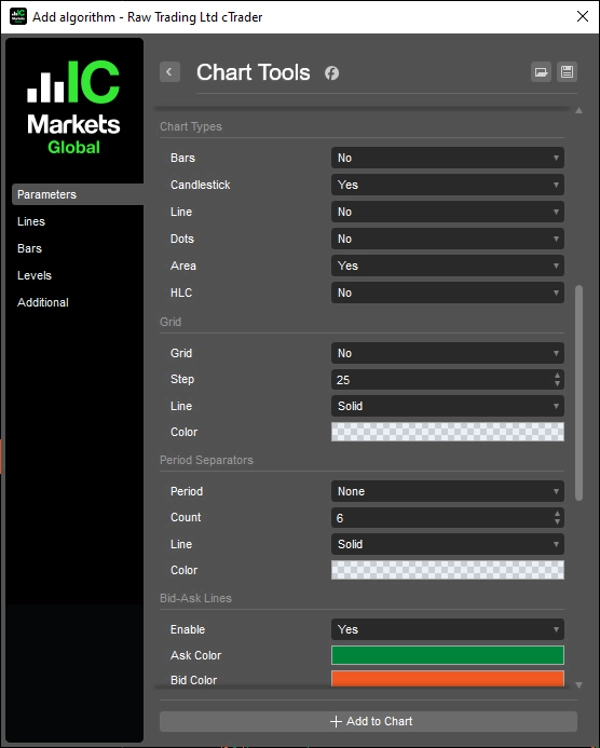
Chart Type
- Quick-switch buttons for: Bars, Candlestick, Line, Dots, Area, HLC
- Active chart type highlighted automatically
- Each button individually configurable via parameters
Grid
- Round numbers-based grid with configurable pip interval (Multiplier)
- Price labels with smart decimal formatting
- Lines extend 10 bars beyond the last bar
- Enable/disable toggle
Period Separators
- Daily, Weekly, Monthly, and Yearly separators
- Configurable count, color, line style, and thickness
- Auto-updates on scroll and zoom
Bid/Ask Lines
- Live bid and ask lines extending to infinity
- Configurable colors for ask and bid
- Enable/disable toggle
Buttons
- Position: Top Right, Top Left, Bottom Right, Bottom Left
- Configurable margin
- Configurable button colors and text colors — including active state, apply zoom, and chart toggle button
__________________________________________________________________________________________
MORE FREE INDICATORS
Explore a wide range of market analysis tools—from structure and volume to regression, volatility, and custom timeframes.
Source code is available on GitHub repository.
All free to use. But if you feel like sending coffee support, you can route it here.
Support/Resistance
Volume
- Volume Activity Profiler
- Volume Efficiency Analyzer
- Volume Profile Analytics
- Volume Profile - Updated
- Volume Spread Analysis
- VWAP (Volume Weighted Average Price)
Moving Averages
- SSL Channel
- Anchored Moving Average
- Deviation-Scaled Moving Average
- Gann High Low Activator
- Instantaneous Trendline
- Kaufman Adaptive MA with Trend Vision
- Moving Average Channel
- Moving Averages Suite
- Trend Channel Moving Average
Utilities/Custom
Regression-Based
Volatility
Oscillators
__________________________________________________________________________________________
DISCLAIMER
Trading involves risk. This indicator is intended for technical analysis only — always apply proper risk management and trade responsibly.
FEECBACK & IMPROVEMENTS
If you have suggestions, feature requests, or ideas for enhancement, please leave a comment in the Discussion tab. Your feedback helps improve the indicator for everyone.
Summary
Users can configure a quick-access row of favorite timeframes supporting all timeframe types. The chart type switcher offers quick buttons for Bars, Candlestick, Line, Dots, Area, and HLC charts, each with individual configuration and automatic active state highlighting.
Additional features include a round numbers-based grid with configurable pip intervals and smart decimal formatting, daily to yearly period separators with customizable appearance, and live bid/ask lines extending indefinitely with color customization and toggle options.
The control panel’s buttons can be positioned in any corner of the chart with configurable margins and colors, including active states and zoom application. This tool aims to streamline active trading sessions by reducing time spent navigating native menus, supporting efficient technical analysis on various chart types and timeframes.
Customer reviews
5 | 100 % | |
4 | 0 % | |
3 | 0 % | |
2 | 0 % | |
1 | 0 % |