Brokers & props
For business
00
Days
:
00
Hours
:
00
Minutes
:
00
Seconds
Indicator
Breakout
Fibonacci
Linear Regression Channel
06/12/2025
37
Desktop
Since 20/12/2024
Free installs
934
"Linear Regression Channel" uploaded image"Linear Regression Channel" uploaded image"Linear Regression Channel" uploaded image"Linear Regression Channel" uploaded image

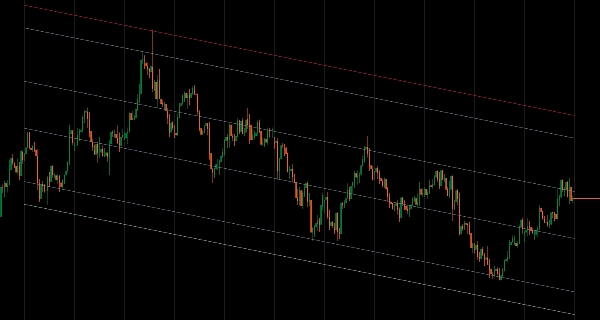
Statistical price channels with flexible calculation modes and deviation-based band rendering.


Fits regression lines through price data using Period Mode (last N bars), DateTime Mode (from specific dates), or Lock Mechanism to freeze analysis at historical points while price continues.

Three deviation methods (Average, Independent, Maximum) for symmetric and asymmetric channels, six Fibonacci retracement levels (11.4% to 88.6%), multi-timeframe analysis, six price types (Open/High/Low/Close/Median/Typical), historical-only mode for stable backtesting, and extend-to-infinity projection deliver comprehensive regression analysis for traders targeting mean reversion zones and statistical price boundaries across market conditions.


Features


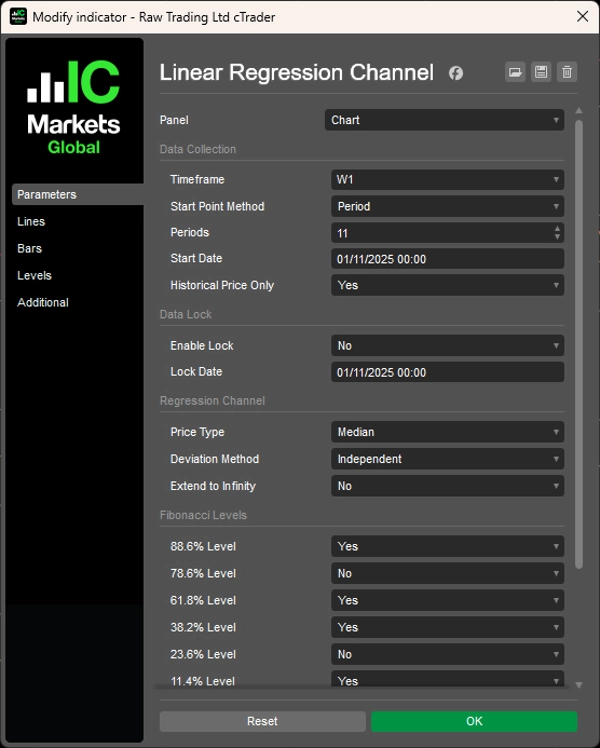
Flexible Data Selection

  • Period Mode: Analyze last N bars (e.g., last 12 monthly candles)
  • DateTime Mode: Start from specific market events or dates
  • Lock Mechanism: Freeze analysis at a historical point while price continues
  • Multi-Timeframe: Draw regression from any timeframe on your current chart


Smart Deviation Methods

  • Average: Balanced levels using mean deviations—ideal for trading zones
  • Independent: Asymmetric channels that adapt to directional volatility
  • Maximum: Shows extreme price boundaries for full range analysis


Professional Analysis Tools

  • 6 Fibonacci retracement levels (11.4%, 23.6%, 38.2%, 61.8%, 78.6%, 88.6%)
  • 6 price types: Open, High, Low, Close, Median, Typical
  • Historical-only mode: Exclude forming bars for stable backtesting
  • Extend to infinity option for long-term projections


Full Customization

  • Complete color customization for all channel elements
  • Independent control over regression line and deviation bands
  • Clean visual presentation for focused analysis


Advanced Capabilities

  • Lock feature for event-based analysis studies
  • Combine higher timeframe structure with lower timeframe execution
  • Symmetric and asymmetric channel options for different market conditions


__________________________________________________________________________________________


More Free Indicators


Check out my other indicators—each one built with production-level code quality and practical features traders actually need.

All free to use. But if you feel like sending coffee support, you can route it to tinyurl(dot)com/coffee-supply


Moving Averages


Regression-Based


Support/Resistance


Volatility


Volume Indicators


Utilities/Custom


__________________________________________________________________________________________


Disclaimer

Trading involves risk. This indicator is intended for technical analysis only — always apply proper risk management and trade responsibly.


Feedback & Improvements

If you have suggestions, feature requests, or ideas for enhancement, please leave a comment in the Discussion tab. Your feedback helps improve the indicator for everyone.

0.0
Reviews: 0
Customer reviews
No reviews for this product yet. Already tried it? Be the first to tell others!
More from this author
VWAP (Volume Weighted Average Price)
Customizable VWAP with flexible reset, three band methods, and full Fibonacci level control.
Fair Value Gap
FVG Detector: Identify and label Fair Value Gaps, with age, status & multi-timeframe support.
Indicator
Fibonacci
Simple Pivot Points
Clear pivot levels. Clean S/R zones. Five methods. Any timeframe.
Volume Profile Analytics
Volume distribution analysis with Market Profile TPO integration.
Indicator
Breakout
Higher Timeframe Candlestick
Overlay a real-time higher-timeframe candle on your chart — color-coded bias without switching TFs.
Indicator
FVG
Fibonacci
Fair Value Gap (Extended)
Detect FVGs with age, status, Fibonacci levels, and customizable fill threshold—extended version.
Indicator
Breakout
Round Number
Plots automatic psychological levels at round-number zones – major structure & liquidity levels.
Indicator
Bollinger
Trend Channel Moving Average
Complete MA-channel system: colored trend, channel boundaries & equilibrium with 6 Fib zones.
Indicator
Indices
Commodities
Stocks
+2
Moving Averages Suite
28-method MA library in one indicator — from classic EMAs to adaptive & zero-lag variants.
Indicator
Scalping
Nadaraya-Watson Kernel Regression
Ultra-smooth adaptive trend line via Gaussian kernel regression — low lag, clean structure.
Indicator
Scalping
Kaufman Adaptive MA with Trend Vision
Adaptive KAMA: fast in trend, slow in noise — with color-coded market state visualization.
Indicator
Breakout
Fibonacci
Initial Balance
Track Initial Balance ranges across any period with optional Fibonacci levels and projections.
Indicator
Breakout
ATR
Scalping
Trend Volatility Trail
A volatility-adaptive trend-following indicator that dynamically adjusts to market conditions.
Indicator
Indices
Stocks
Commodities
+2
Moving Average Channel
Price channel system built on moving averages—track trend direction, momentum shifts, and mean reversion zones.
Indicator
Indices
Stocks
Commodities
+2
Custom Timeframes
Custom and native timeframes display with OHLC lines, moving averages, and Fibonacci levels.
Indicator
Fibonacci
Anchored Moving Average
Anchor a moving average to any point on the chart and watch it extend dynamically as price evolves.
Indicator
Indices
Stocks
Commodities
+2
Deviation-Scaled Moving Average
Momentum-adaptive MA: scales responsiveness via deviation — fast in trend, smooth in chop.
Indicator
Fibonacci
Advanced Regression Channel
Regression channels with Fibonacci levels across multiple regression types, timeframes, and custom date ranges.
You may also like
Indicator
Grid
NAS100
NZDUSD
+18
Supertrend Indicator v1.1
SUPERTREND INDICATOR v1.1
Indicator
NAS100
RSI
NZDUSD
+19
SMC + FVG Binary Signal Pro
SMC/ICT signals using FVG + liquidity sweep/MSS with EMA-RSI-MACD filters, clear visuals, and actionable alerts.
Indicator
NAS100
Breakout
XAUUSD
+14
Initial Range
Initial Range – Where the open writes the script.
Indicator
RSI
Breakout
XAUUSD
+4
SmartTrend Support & Resistance Lines
🚀 Auto-detects support/resistance & trend channels! Saves time ⏳, spots key levels 🔍
Pivot Points Clasic,FIBO,etc
All-in-one Pivot Indicator: set Classic, Fibo, Woodie, Camarilla, Demark methods, style levels & labels your way ;)
Indicator
NAS100
NZDUSD
Breakout
+14
Bollinger Bands Cloud
Visualize Bollinger Bands with a colored cloud for clarity. Enhance your trading precision with this dynamic indicator!
ZigZagSmartAlert_demo
ZigZag Smart Alert DEMO for cTrader DEMO VERSION 24 hours free trial! This is a DEMO version of the ZigZag Smart Aler
Indicator
XAUUSD
Forex
EURUSD
+2
ALMA Smoothed Gaussian Moving Average
ALMA Smoothed Gaussian Moving Average (ASGMA) – by LudwigICT
Order Block detector PRO
Order Block PRO — Smart Institutional Zone Detector
Indicator
XAUUSD
Volume Profile Fixed Range - Pro
Professional Volume Profile Indicator - Shows volume distribution, POC, Value Areas & Buy/Sell pressure.
Indicator
Indices
ADXMultiframeIndicator
Multi-Timeframe ADX Trend Dots & Arrows
Indicator
ATR
Forex
Supertrend
+3
MA_Cross_Signal
Advanced MA crossover indicator. All MA types supported. Clear signals with customizable arrows Perfect for all trader
Indicator
NAS100
NZDUSD
Martingale
+26
Skew Volatility Bias Indicator
Trade with the hidden edge — identify bullish and bearish dominance instantly
Tape reader
TAPE READER :-)
Indicator
NAS100
NZDUSD
Breakout
+15
Professional-grade Anchored VWAP
It calculates Anchored VWAP and StdDev bands from a user-defined start date for cTrader charts.
Indicator
ZigZag
Indices
Breakout
+1
Auto Tools Suite-Trial-7D
DEMO — 7‑day trial. The indicator deactivates after 7 days from Trial Start (UTC ISO8601) (or from first attach if empty
Laguerre RSI
Laguerre RSI is based on John EHLERS' Laguerre Filter to avoid the noise of RSI.
Indicator
Breakout
Higher Timeframe Candlestick
Overlay a real-time higher-timeframe candle on your chart — color-coded bias without switching TFs.